আরও দেখুন

 11.12.2025 11:06 AM
Trend Analysis (Fig. 1)
On Thursday, from the level of 1.3378 (yesterday's daily candle close), the market may begin moving downward toward the target of 1.3378 – the 5-period EMA (thin red line). From this line, the price may possibly rebound upward toward the target of 1.3400 – a historical resistance level (blue dotted line).
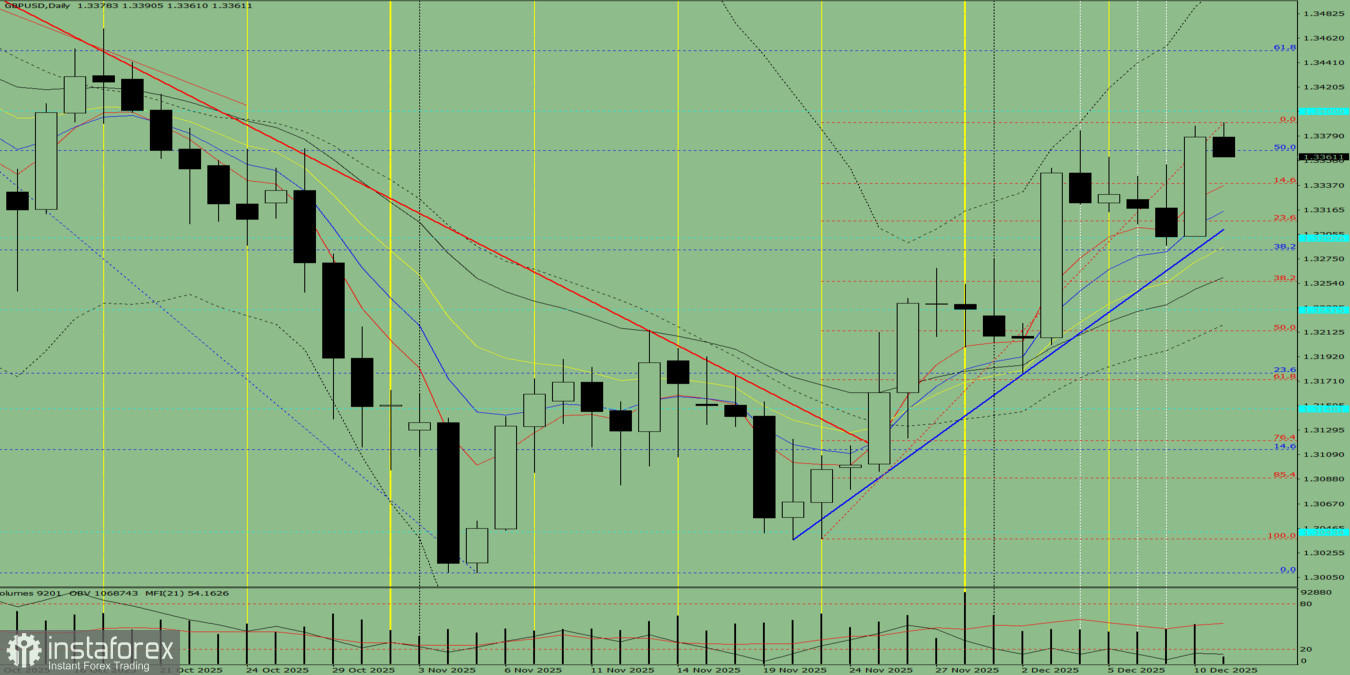
Fig. 1 (Daily Chart)
Comprehensive Analysis:
Overall conclusion: a downward trend.
Alternative Scenario:From the level of 1.3378 (yesterday's daily candle close), the price may begin moving downward toward the target of 1.3316 – the 8-period EMA (thin blue line). From this line, the price may possibly rebound upward toward the target of 1.3367 – the 50% retracement level (blue dotted line).
You have already liked this post today
*এখানে পোস্ট করা মার্কেট বিশ্লেষণ আপনার সচেতনতা বৃদ্ধির জন্য প্রদান করা হয়, ট্রেড করার নির্দেশনা প্রদানের জন্য প্রদান করা হয় না।


