empty
13.08.2024 06:05 AM
Technical Analysis of Intraday Price Movement of USD/JPY Main Currency Pairs, Tuesday August 13, 2024.

This image is no longer relevant

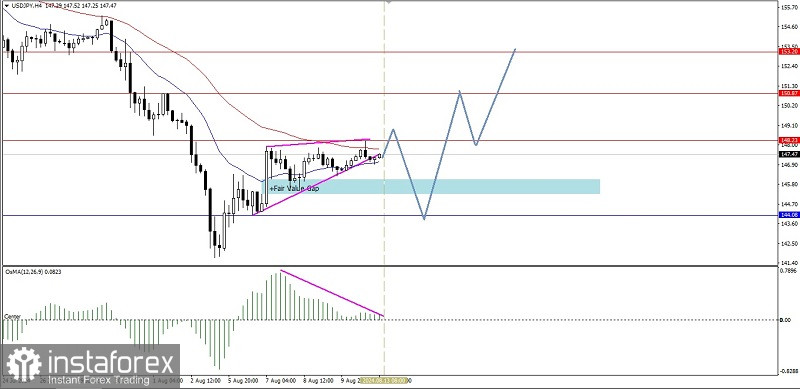
Looking at the condition of the main currency pair USD/JPY on the 4-hour chart, although there is currently a strengthening correction, in general it is still under seller pressure, this can be seen from the EMA 20 which is still below the EMA 50 even though the price movement is in the middle of the two EMAs, which indicates that a Sideways condition is occurring, but with the appearance of deviations from the price movement of USD/JPY which makes Higher-High while the Stochastic Oscillator indicator actually forms a Higher Low, it emphasizes that in the near future there will be a weakening again in USD/JPY where 144.08 will be tested if this level is strong enough to withstand the rate of weakening, then USD/JPY has the potential to strengthen again to the level of 148.23, even if this level is successfully broken upwards, 150.87 will be the main target to be aimed at and if the momentum and volatility support it, then 153.20 will be the next target that will be tried to be pursued and tested.

(Disclaimer)

Recommended Stories

XAU/USD. Analysis and Forecast

Gold prices are declining for the second consecutive day from record highs after volatility triggered by the Fed's actions. For the second day in a row, gold prices are retreating

Irina Yanina 20:12 2025-09-18 UTC+2

Forecast for EUR/USD on September 18, 2025

On Wednesday, the EUR/USD pair rebounded from the 127.2% corrective level at 1.1896, reversed in favor of the U.S. dollar, and fell into the support zone of 1.1789–1.1802

Samir Klishi 12:21 2025-09-18 UTC+2

Forecast for GBP/USD on September 18, 2025

On the hourly chart, the GBP/USD pair on Wednesday rose to the 127.2% Fibonacci level at 1.3708, rebounded from it, and reversed in favor of the U.S. dollar, falling into

Samir Klishi 12:17 2025-09-18 UTC+2

GBP/USD. Indicator analysis on September 18, 2025

On Wednesday, the pair moved upward to resistance at 1.3725 (blue dotted line), then turned downward, closing the daily candle at 1.3622. Today, it may continue moving lower. On Thursday

Stefan Doll 11:59 2025-09-18 UTC+2

EUR/USD. Indicator analysis on September 18, 2025

On Wednesday, the pair moved upward to the 208% level at 1.1908 (red dotted line), then turned downward, closing the daily candle at 1.1812. Today, it may continue moving lower

Stefan Doll 11:38 2025-09-18 UTC+2

Forex forecast 18/09/2025: EUR/USD, GBP/USD, USD/JPY, USDX and Bitcoin

Useful links: My other articles are available in this section InstaForex course for beginners Popular Analytics Open trading account Important: The begginers in forex trading need to be very careful

Sebastian Seliga 10:14 2025-09-18 UTC+2

There is potential for XPD/USD to weaken today with the appearance of a Hidden Bearish Divergence. Thursday, September 18, 2025.

[XPD/USD] – [Thursday, September 18, 2025] The appearance of a Hidden Bearish Divergence, coupled with the two EMAs crossing with a Death Cross, indicates that Palladium has the potential

Arief Makmur 07:28 2025-09-18 UTC+2

The Nasdaq 100 Index has the potential to strengthen today, reaching its nearest resistance level. Thursday, September 18, 2025.

[Nasdaq 100 Index] – [Thursday, September 18, 2025] The Nasdaq 100 Index has the potential to strengthen today, as confirmed by its two EMAs intersecting in a Golden Cross

Arief Makmur 07:28 2025-09-18 UTC+2

Trading Signals for EUR/USD for September 18-23, 2025: buy above $1.1790 (+1/8 Murray - 21 SMA)

Early in the European session, the euro is trading around 1.1813 following a technical correction after the price reached a new high around 1.1917. The euro has been trading within

Dimitrios Zappas 06:50 2025-09-18 UTC+2

Trading Signals for GOLD (XAU/USD) for September 18-23, 2025: sell bellow $3,671 (7/8 Murray - 21 SMA)

Conversely, if gold consolidates above $3,671, it could continue its rise until it reaches the 61.8% Fibonacci level around $3,685. The price could even reach the psychological level of $3,700

Dimitrios Zappas 06:48 2025-09-18 UTC+2
Can't speak right now?
Ask your question in the chat.
 

Dear visitor,

Your IP address shows that you are currently located in the USA. If you are a resident of the United States, you are prohibited from using the services of InstaFintech Group including online trading, online transfers, deposit/withdrawal of funds, etc.

If you think you are seeing this message by mistake and your location is not the US, kindly proceed to the website. Otherwise, you must leave the website in order to comply with government restrictions.

Why does your IP address show your location as the USA?

  • - you are using a VPN provided by a hosting company based in the United States;
  • - your IP does not have proper WHOIS records;
  • - an error occurred in the WHOIS geolocation database.

Please confirm whether you are a US resident or not by clicking the relevant button below. If you choose the wrong option, being a US resident, you will not be able to open an account with InstaTrade anyway.

We are sorry for any inconvenience caused by this message.