empty
14.06.2019 02:38 AM
EUR / USD h4 vs USD / JPY h4 vs EUR / JPY. Comprehensive analysis of the movement options from June 14, 2019. Analysis of APLs & ZUP

Let me bring to your attention a comprehensive analysis of the options for the development of the movement of EUR / USD vs USD / JPY vs EUR / JPY in the Minuette (h4) operational scale from June 14, 2019

____________________

Euro vs US Dollar

The movement of the single European currency EUR / USD comes within the boundaries of the 1/2 Median Line channel (1.1295 <-> 1.1270 <-> 1.1250) Minuette operational scale fork. The options for working off of these levels are presented on the animated graphics.

The breakdown of the level of support 1.1250 on the lower boundary of the channel of the 1/2 Median Line Minuette will make relevant continuation of the movement of the EUR / USD to the boundaries of the equilibrium zone (1.1235 <-> 1.1200 <-> 1.1170) Minuette operational scale fork.

In the case of the return of the single European currency above the upper boundary (the level of resistance of 1.1310) channel of the 1/2 Median Line Minuette, can continue the upward movement of EUR / USD to the boundaries of the equilibrium zone (1.1310 <-> 1.1340 <-> 1.1375) Minuette operational scale fork.

The markup of EUR / USD movement options is shown in the animated graphic.

This image is no longer relevant

____________________

US Dollar vs Japanese Yen

Just like in the case of EUR / USD, the development movement of the currency pair USD / JPY from June 14, 2019 will be determined by working off the boundary levels of the channel of the 1/2 Median Line (108.70 <-> 108.45 <-> 108.15) Minuette operational scale fork. More details can be found in the graphic shown below.

The breakdown of the upper boundary (the level of resistance 108.70) channel of the 1/2 Median Line Minuette -> version of the continuation of the upward movement of the currency instrument to balance zone (109.15 <-> 109.50 <-> 109.75) Minuette operational scale fork.

On the other hand, if there is a breakdown of the support level of 108.15 (lower boundary of the channel of the 1/2 Median Line Minuette), then the downward movement of USD / JPY can be continued to the targets -> initial SSL line (107.90) of the Minuette operational scale fork <-> LTL Minuette control line (107.60) <-> control line LTL Minuette (107.35) <-> warning line LWL38.2 Minuette (107.00).

Markup options for the USD / JPY movement can be seen at the animated graphic.

This image is no longer relevant

____________________

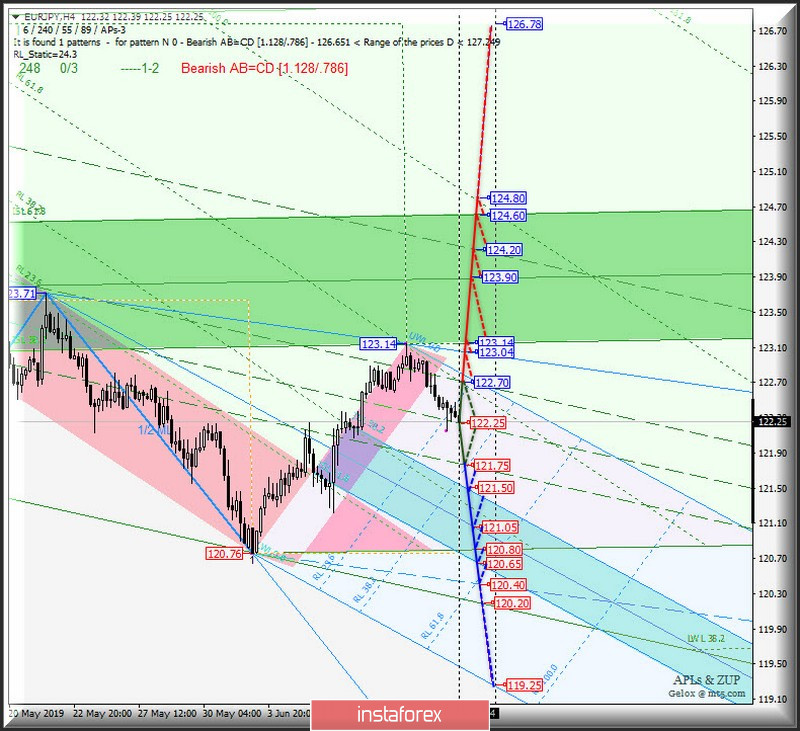
Euro vs Japanese Yen

The development of the movement of cross-instrument EUR / JPY for June 14, 2019 is due to the direction of the breakdown of the boundaries of the channel of the 1/2 Median Line (122.70 <-> 122.25 <-> 121.75) Minuette operational scale forks.

In case of the breakdown of the level of resistance 122.70 (upper boundary channel of the 1/2 Median Line Minuette), the upward movement of the cross-instrument will continue to the reference line UTL (123.04) Minuette operating scale fork and boundaries of the equilibrium zone (123.14 <-> 123.90 <-> 124.60) Minuette operating scale fork.

A development of the downward movement of EUR / JPY may continue after the breakdown of the level of support of 121.75 (the lower boundary of the channel of the 1/2 Median Line Minuette), and signified it will be sent to the equilibrium zone (121.50 <-> 121.05 <-> 120.65) Minuette operational scale fork with the prospect of reaching the ultimate Schiff Line Minuette (120.40).

Marking options for the movement of the cross-instrument EUR / JPY is presented in the animated graphic ->

This image is no longer relevant

____________________

The review was compiled without taking into account of the news background. The opening of trading sessions of the main financial centers does not serve as a guide to action (placing orders "sell" or "buy").

Ratu Taslim,
Analytical expert of InstaTrade
© 2007-2025

Recommended Stories

The Nasdaq 100 Index will attempt to test its nearest resistance level today, Thursday, July 31, 2025.

Nasdaq 100 Index – Thursday, July 31, 2025. With the Golden Cross of the 50-day (EMA)50 and (EMA)200 and the position of RSI (14)in an Extreme Bullish condition, the Nasdaq

Arief Makmur 08:03 2025-07-31 UTC+2

The potential for weakness in EUR/GBP remains open today, Thursday, July 31, 2025.

EUR/GBP – Thursday, July 31, 2025. With the 50-day moving average (EMA) condition below the 200-day moving average (EMA) and supported by the appearance of "Hidden Divergence" from

Arief Makmur 08:02 2025-07-31 UTC+2

Trading Signals for EUR/USD for July 31 - August 02, 2025: buy above 1.1400 (21 SMA - 6/8 Murray)

If the euro continues its downtrend, it could reach the 5/8 Murray level at 1.1352. This level could provide an opportunity for a technical rebound, as the indicators are showing

Dimitrios Zappas 07:26 2025-07-31 UTC+2

Trading Signals for GOLD (XAU/USD) for July 31 - August 02, 2025: buy above $3,281 (21 SMA - 4/8 Murray)

Early in the European session, gold is trading around 3,296, bouncing after reaching the area of 3,268, a key level that gave it a strong technical rebound. We now expect

Dimitrios Zappas 07:25 2025-07-31 UTC+2

Trading Signals for BITCOIN for July 31 - August 2, 2025: sell below $118,750 (6/8 Murray - 21 SMA)

If Bitcoin consolidates above $119,000 in the coming days, it could signal a bullish move. So, we believe it could reach the 7/8 Murray level at 121,878 and even

Dimitrios Zappas 07:23 2025-07-31 UTC+2

EUR/USD Forecast for July 31, 2025

Following yesterday's FOMC meeting, the current rate was left unchanged, and the markets received a clear signal — the rate may also remain unchanged at the September meeting. Now, markets

Laurie Bailey 05:10 2025-07-31 UTC+2

GBP/USD Forecast for July 31, 2025

On the weekly chart, the British pound has crossed the MACD line from top to bottom. The Marlin oscillator lacks just a slight push to move into negative (bearish) territory

Laurie Bailey 05:10 2025-07-31 UTC+2

AUD/USD Forecast for July 31, 2025

On Wednesday, the Australian dollar forcefully broke through the support level of 0.6450. However, this level proved to be strong enough — after the breakout, the price returned above

Laurie Bailey 05:10 2025-07-31 UTC+2

XAU/USD. Analysis and Forecast

From a technical perspective on the 4-hour chart, the recent break below the 100-period Simple Moving Average (SMA) has been viewed as a key bearish signal. Additionally, the oscillators

Irina Yanina 12:08 2025-07-30 UTC+2

EUR/USD. July 30th. Bears have paused, but new challenges await them

On Tuesday, the EUR/USD pair continued its downward movement and closed below the 100.0% Fibonacci retracement level at 1.1574. This suggests that the decline may continue on Wednesday, targeting

Samir Klishi 12:02 2025-07-30 UTC+2
Can't speak right now?
Ask your question in the chat.
 

Dear visitor,

Your IP address shows that you are currently located in the USA. If you are a resident of the United States, you are prohibited from using the services of InstaFintech Group including online trading, online transfers, deposit/withdrawal of funds, etc.

If you think you are seeing this message by mistake and your location is not the US, kindly proceed to the website. Otherwise, you must leave the website in order to comply with government restrictions.

Why does your IP address show your location as the USA?

  • - you are using a VPN provided by a hosting company based in the United States;
  • - your IP does not have proper WHOIS records;
  • - an error occurred in the WHOIS geolocation database.

Please confirm whether you are a US resident or not by clicking the relevant button below. If you choose the wrong option, being a US resident, you will not be able to open an account with InstaTrade anyway.

We are sorry for any inconvenience caused by this message.