empty
13.01.2022 09:12 AM
Wave analysis for EUR/USD on January 13, 2021

EUR/USD, H4 timeframe:

This image is no longer relevant

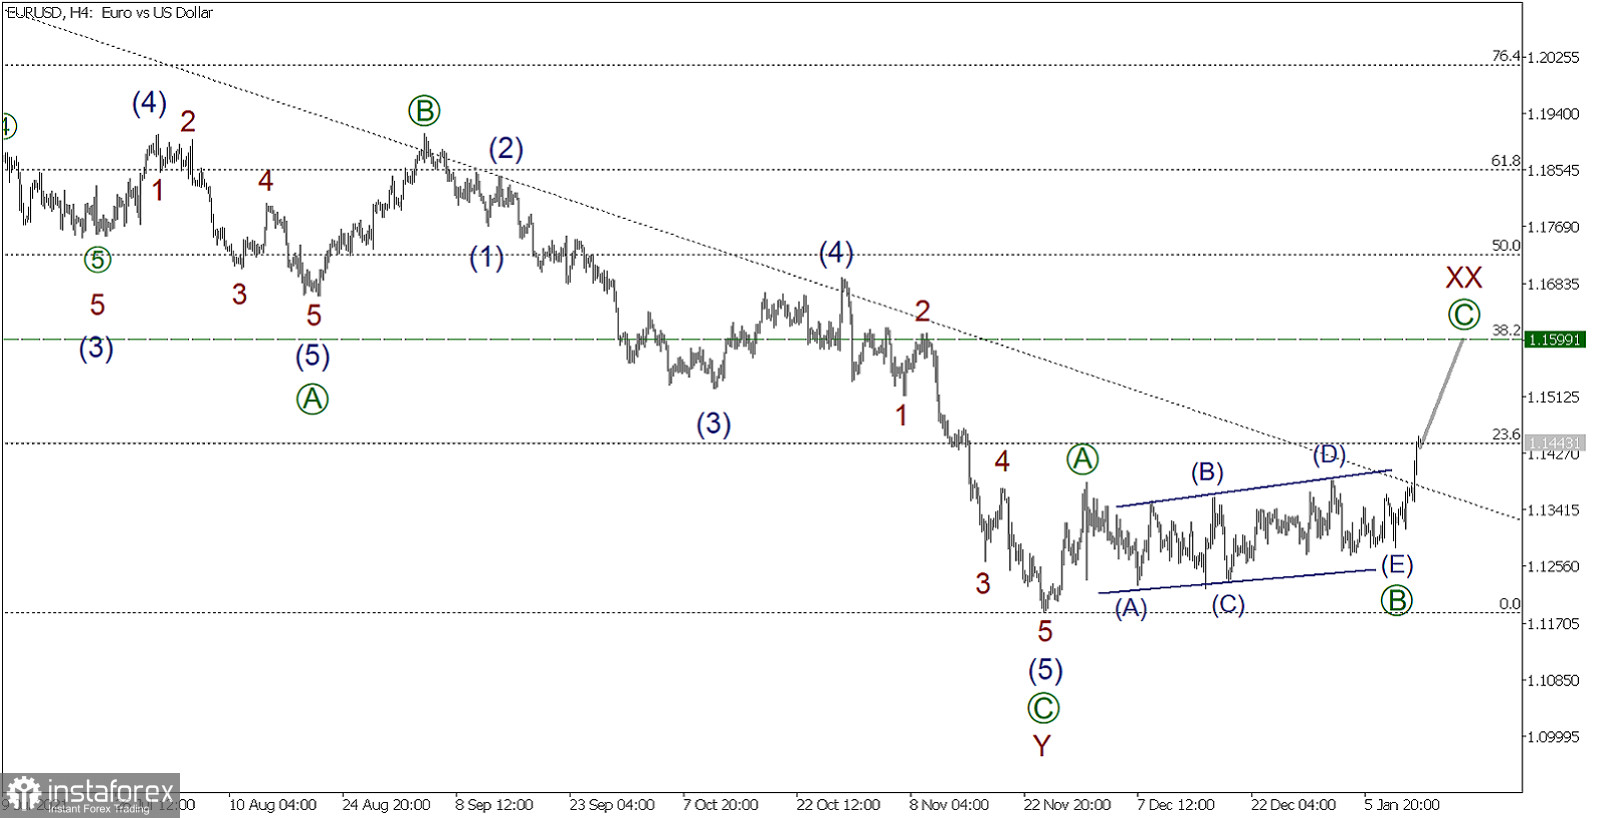
The situation of the EUR/USD indicates that the market followed an alternative scenario. Earlier, it was assumed that the zigzag wave Y is not completed yet, but yesterday's strong upward movement made it clear that the bundle XX wave is already forming, consisting of three sub-waves [A], [B], and [C] which takes the form of a zigzag.

Special attention should be paid to the fact that wave [B], which is now being formed, has taken a triangle shape. Given the fact that both forming lines of this triangle are directed upwards, it can be concluded that this triangle is inclined since during its formation, the bulls shifted this pattern upward. This indicates their strength, which is why a powerful bullish impulse [C] can be expected after this triangle is completed.

According to the rules of wave analysis, Wave [C] will be completed where the development of the entire wave of the XX bundle is completed. The endpoint of this wave can be determined by the Fibonacci lines. Wave XX is likely to end at the 1.1599 level, from which its value will be 38.2% of the previous downward wave Y. Therefore, the price may rise to the specified level in the near future.

For today's news background, important data on the number of initial applications for unemployment benefits will be published in the US at 13:30 Universal time. At the same time, the PPI (Producer Price Index) will also be released. This news may encourage the price to move bullishly in wave [C] towards the target.

Trading recommendations:

It is possible to open long positions from the current level with a target at the expected completion point of wave XX, i.e., at the level of 1.1599.

Roman Onegin,
Analytical expert of InstaTrade
© 2007-2025

Recommended Stories

EUR/USD Analysis on September 18, 2025

The wave structure on the 4-hour chart for EUR/USD has remained unchanged for several months, which is very encouraging. Even when corrective waves form, the integrity of the structure

Chin Zhao 19:35 2025-09-18 UTC+2

Analysis of EUR/USD on September 17, 2025

The wave pattern on the 4-hour chart for EUR/USD has not changed for several months, which is very encouraging. Even when corrective waves are formed, the overall structure remains intact

Chin Zhao 20:53 2025-09-17 UTC+2

Analysis of GBP/USD on September 17, 2025

The wave structure for GBP/USD continues to indicate the formation of an upward impulsive wave sequence. The wave pattern is almost identical to EUR/USD, as the only "driver" remains

Chin Zhao 20:44 2025-09-17 UTC+2

GBP/USD Analysis on September 16, 2025

For GBP/USD, the wave count continues to indicate the formation of an upward impulse structure. The wave pattern is almost identical to that of EUR/USD, since the only "culprit" remains

Chin Zhao 19:10 2025-09-16 UTC+2

EUR/USD Analysis on September 16, 2025

The wave structure on the 4-hour chart for EUR/USD has not changed for several months, which is encouraging. Even during the formation of corrective waves, the integrity of the structure

Chin Zhao 19:00 2025-09-16 UTC+2

GBP/USD Analysis on September 15, 2025

The wave pattern for GBP/USD continues to indicate the formation of a bullish impulse structure. The wave picture is almost identical to that of EUR/USD since the sole "culprit" remains

Chin Zhao 20:00 2025-09-15 UTC+2

EUR/USD Analysis on September 15, 2025

The wave structure of the 4-hour EUR/USD chart has remained unchanged for several months, which is encouraging. Even when corrective waves form, the overall structure holds together. This makes accurate

Chin Zhao 19:58 2025-09-15 UTC+2

Weekly Forecast Using Simplified Wave Analysis for GBP/USD, AUD/USD, USD/CHF, EUR/JPY, US Dollar Index, Bitcoin, and Gold as of September 15th

At the beginning of the upcoming week, the British currency is expected to move sideways with a bearish vector toward calculated support. After that, price movement may shift into

Isabel Clark 19:35 2025-09-15 UTC+2

Weekly Forecast Using Simplified Wave Analysis for EUR/USD, USD/JPY, EUR/CHF, EUR/GBP, AUD/JPY, Ethereum, and Litecoin as of September 15th

In the first days of the upcoming week, the most likely scenario for the euro is sideways price movement along resistance boundaries. Toward the weekend, the probability of increased volatility

Isabel Clark 19:27 2025-09-15 UTC+2

GBP/USD Analysis on September 10, 2025

The wave pattern for GBP/USD continues to point to the formation of a bullish impulsive wave structure. The wave picture is almost identical to that of EUR/USD, since the only

Chin Zhao 18:22 2025-09-10 UTC+2
Can't speak right now?
Ask your question in the chat.
 

Dear visitor,

Your IP address shows that you are currently located in the USA. If you are a resident of the United States, you are prohibited from using the services of InstaFintech Group including online trading, online transfers, deposit/withdrawal of funds, etc.

If you think you are seeing this message by mistake and your location is not the US, kindly proceed to the website. Otherwise, you must leave the website in order to comply with government restrictions.

Why does your IP address show your location as the USA?

  • - you are using a VPN provided by a hosting company based in the United States;
  • - your IP does not have proper WHOIS records;
  • - an error occurred in the WHOIS geolocation database.

Please confirm whether you are a US resident or not by clicking the relevant button below. If you choose the wrong option, being a US resident, you will not be able to open an account with InstaTrade anyway.

We are sorry for any inconvenience caused by this message.