empty
07.02.2022 09:58 AM
EUR/USD, USD/JPY, GBP/JPY, GOLD simplified wave analysis and outlook for February 7

EUR/USD

Analysis:

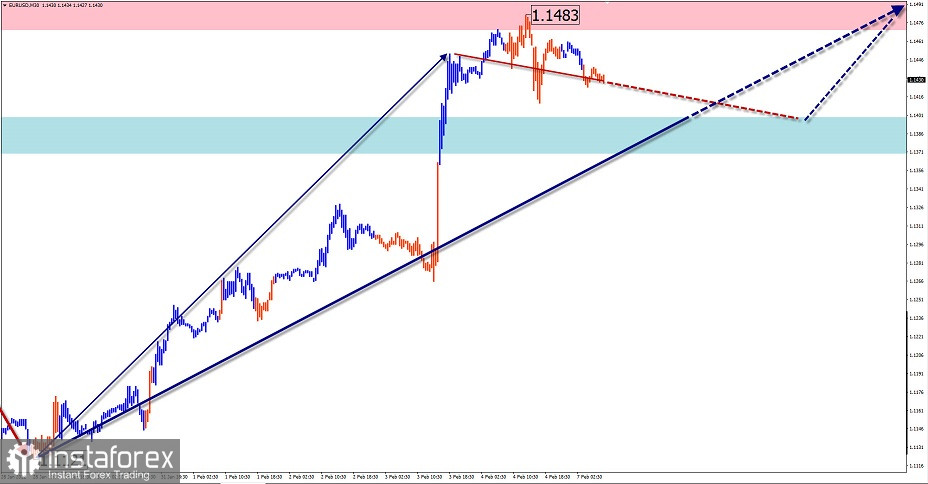
It is highly probable that the upward movement of the European currency from January 28 has given rise to a new wave in the main direction. The price has reached the resistance level of the large timeframe. Before the continuation of the uptrend, the wave level in the correction should be increased.

Outlook:

The euro is expected to move sideways between the closest encounter zones in the next 24 hours. Resumption of price growth is likely at the end of the day or tomorrow.

Potential reversal zones

Resistance:

- 1.1470/1.1500

Support:

- 1.1400/1.1370

Recommendations:

Until the end of the upcoming pullback, trading in the euro market could lead to losses. It is recommended to watch for reversal signals to open long positions at the end of the upcoming pullback.

This image is no longer relevant

USD/JPY

Analysis:

The main Japanese yen pair chart has been dominated by an uptrend since early last year. The incomplete section has been reporting since January 14. A correction has been forming in the wave structure during the last 2 weeks. There are no signals of its completion on the chart at the moment of analysis.

Outlook:

Today, there is a high probability of the yen price moving in the corridor between the closest areas of the counter direction. In the first half of the day, an upward vector is more likely. A rate shift and a rate decrease can be expected at the end of the day or tomorrow.

Potential reversal zones

Resistance:

- 115.60/115.90

Support:

- 115.00/114.70

Recommendations:

Trading in the Japanese yen market today is possible only within individual sessions, with fractional lots. Opening short positions is more risky.

This image is no longer relevant

GBP/JPY

Analysis:

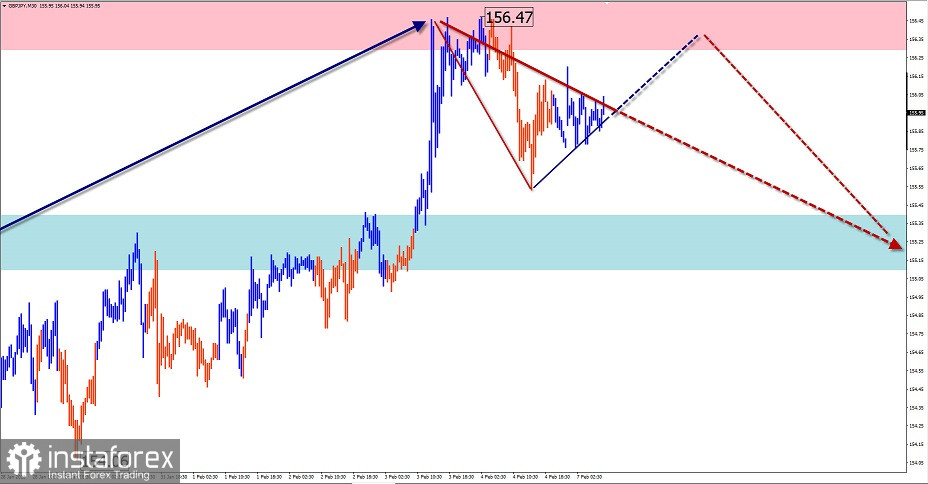
The chart of the English pound and Japanese yen continues its strong move to the north of the price chart. The unfinished section is timing from January 24. The price has reached a powerful resistance. The price needs to correct before it can continue its rise.

Outlook:

Price is expected to move mostly sideways in the coming days. In the first half of the day, an upward vector is more likely. In the resistance zone, a reversal and resumption of price decline can be expected further on.

Potential reversal zones

Resistance:

- 156.30/156.60

Support:

- 155.40/155.10

Recommendations:

In flat conditions, trades carry higher risk and are not recommended. It is optimal to refrain from trading the pair until a pullback is completed, with tracking signals for buying at the end of the pullback.

This image is no longer relevant

GOLD

Analysis:

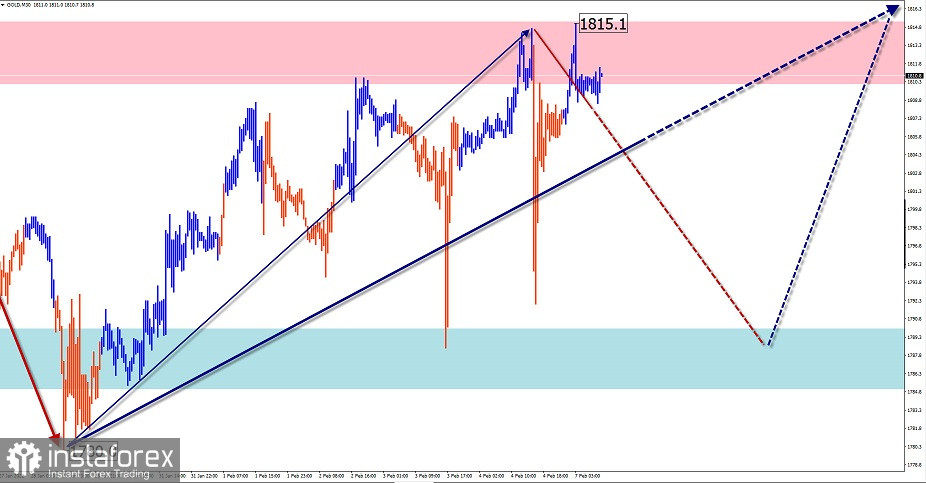
A flat rising wave has been forming on the gold chart since last March. Its structure most closely resembles a horizontal pennant, or a descending triangle. The last unfinished section is ascending from January 28. This wave has unconfirmed reversal potential so far.

Outlook:

In the coming trading sessions, there is a high probability of starting a downward flat from the resistance zone to the area of estimated support. After the end of it, we can expect a renewal of price growth.

Potential reversal zones

Resistance:

- 1810.0/1815.0

Support:

- 1790.0/1785.0

Recommendations:

There are no near-term trading conditions in the gold market. It is recommended to refrain from trading the instrument until there are confirmed buying signals at the end of the upcoming pullback.

This image is no longer relevant

Explanation: In simplified wave analysis (SVA), waves consist of 3 parts (A-B-C). The last unfinished wave is analysed. The solid arrow background shows the structure formed. The dotted arrow shows the expected movements.

Attention: The wave algorithm does not take into account the duration of the instrument movements over time!

Isabel Clark,
Analytical expert of InstaTrade
© 2007-2025

Recommended Stories

EUR/USD Analysis on September 26, 2025

The wave pattern on the 4-hour chart of EUR/USD has remained unchanged for several months, but in recent days it has started to look more complex. It is still

Chin Zhao 20:12 2025-09-26 UTC+2

EUR/USD Analysis on September 25, 2025

The wave pattern on the 4-hour chart for EUR/USD has not changed for several months, which is very encouraging. Even when corrective waves are forming, the structure remains intact. This

Chin Zhao 19:17 2025-09-25 UTC+2

EUR/USD Analysis on September 2, 2025

The wave structure on the 4-hour chart for EUR/USD has remained unchanged for several months, which is very encouraging. Even when corrective waves form, the integrity of the structure

Chin Zhao 18:41 2025-09-24 UTC+2

EUR/USD Analysis on September 23, 2025

The wave layout on the 4-hour chart for EUR/USD has remained unchanged for several months, which is encouraging. Even when corrective waves are being formed, the integrity of the structure

Chin Zhao 18:34 2025-09-23 UTC+2

EUR/USD Analysis on September 22, 2025

The wave analysis on the 4-hour EUR/USD chart has remained unchanged for several months now, which is very encouraging. Even when corrective waves are forming, the overall structure stays intact

Chin Zhao 18:19 2025-09-22 UTC+2

Weekly Forecast Based on Simplified Wave Analysis of GBP/USD, AUD/USD, USD/CHF, EUR/JPY, EUR/CHF, and US Dollar Index – September 22nd

In the coming week, the downward movement in the British pound is expected to complete. In the early part of the week, minor pressure on its lower boundary cannot

Isabel Clark 18:14 2025-09-22 UTC+2

Weekly Forecast Based on Simplified Wave Analysis: EUR/USD, USD/JPY, GBP/JPY, USD/CAD, NZD/USD, EUR/GBP, GOLD – September 22nd

In the coming days, a bullish vector can be expected, with the euro rising to the calculated resistance levels. By the weekend, a reversal is anticipated in this zone, followed

Isabel Clark 18:01 2025-09-22 UTC+2

EUR/USD Analysis on September 19, 2025

The wave pattern on the 4-hour chart for EUR/USD has remained unchanged for several months, which is very encouraging. Even when corrective waves form, the structure's integrity is preserved, allowing

Chin Zhao 21:11 2025-09-19 UTC+2

EUR/USD Analysis on September 18, 2025

The wave structure on the 4-hour chart for EUR/USD has remained unchanged for several months, which is very encouraging. Even when corrective waves form, the integrity of the structure

Chin Zhao 19:35 2025-09-18 UTC+2

Analysis of EUR/USD on September 17, 2025

The wave pattern on the 4-hour chart for EUR/USD has not changed for several months, which is very encouraging. Even when corrective waves are formed, the overall structure remains intact

Chin Zhao 20:53 2025-09-17 UTC+2
Can't speak right now?
Ask your question in the chat.
 

Dear visitor,

Your IP address shows that you are currently located in the USA. If you are a resident of the United States, you are prohibited from using the services of InstaFintech Group including online trading, online transfers, deposit/withdrawal of funds, etc.

If you think you are seeing this message by mistake and your location is not the US, kindly proceed to the website. Otherwise, you must leave the website in order to comply with government restrictions.

Why does your IP address show your location as the USA?

  • - you are using a VPN provided by a hosting company based in the United States;
  • - your IP does not have proper WHOIS records;
  • - an error occurred in the WHOIS geolocation database.

Please confirm whether you are a US resident or not by clicking the relevant button below. If you choose the wrong option, being a US resident, you will not be able to open an account with InstaTrade anyway.

We are sorry for any inconvenience caused by this message.