empty
10.06.2022 11:14 AM
Analysis of EUR/GBP on June 10, 2022

Hi everyone!

Traditionally, I make an analysis of the euro/pound par on Friday. In today's two previous articles on the euro/dollar and pound/dollar pairs, I analyzed the results of yesterday's ECB meeting, the market reaction, and the main risks for the UK economy. For this reason, in this article, I will focus mainly on the technical analysis of EUR/GBP. Let's look at the weekly chart.

Weekly

This image is no longer relevant

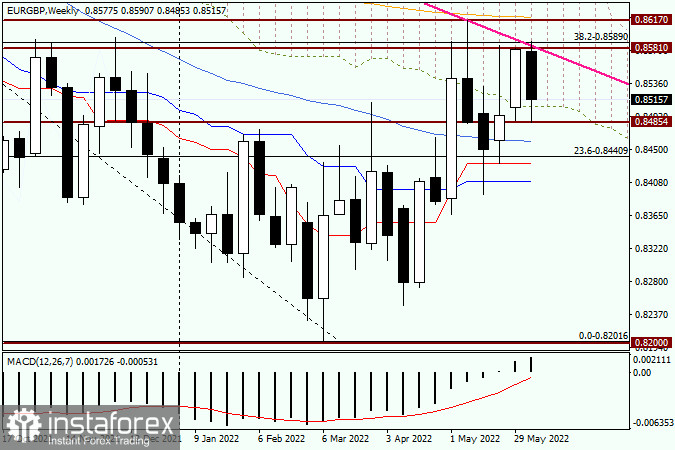
Despite the fact that the euro/pound finished last week near the Ichimoku Cloud, the bears were not ready to give up. As seen on the chart, the pair has been trading in a bearish channel during this week. Sellers have even tried to push the price below the Ichimoku Cloud. Thus, they will do everything possible to end the week near the cloud. Some sellers will try to complete the week near the indicator, while others, on the contrary, will try to push the price down. Judging by technical indicators, there is a strong resistance area of 0.8581-0.8617. At the first level, the highest level of last week was located. The bulls' attempts to break through the resistance level of 0.8581 only led to a false breakout.

The support level indicates last week's lows as trading was carried out at 0.8487. The attempts of bears to push the pair below this level were also unsuccessful. Given the technical outlook on the weekly chart, the bullish trend is possible only after a breakout of the resistance level of 0.8617 and the 200 exponential moving average, which is located at this level. Bears have a more difficult task. They need to push the price to all previously passed indicators: 50 moving average, the Tenkan, and Kijun lines. Currently, the pair is n the correction phase. After a decline to 0.9216-0.8201, the pair retreated to the Fibonacci level of 38.2 which shows a bearish trend. Thus, the EUR/GBP pair is in a downtrend channel. It is also confirmed by the pink resistance line. Attempts to break through this line were also unsuccessful.

Daily

This image is no longer relevant

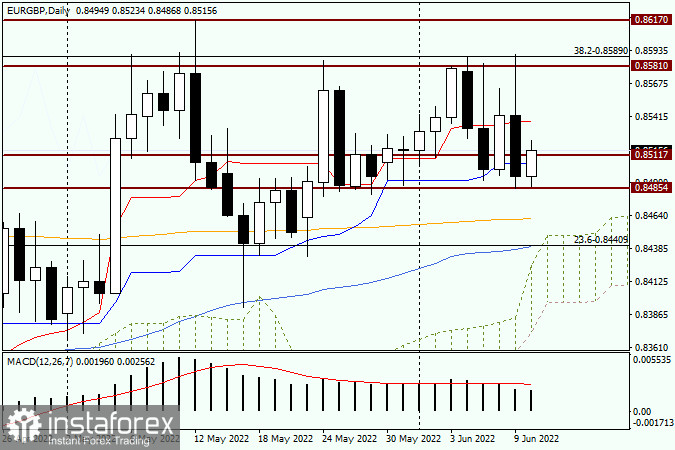
Yesterday's daily candlestick is very similar to the one that was formed for the EUR/GBP pair. After a rise to 0.8590, there was a sharp downward reversal to 0.8485. Apparently, this is a strong technical level as it has stopped yesterday's fall but also facilitated today's growth. If the euro/pound pair continues to rise, it will face resistance near the Tenkan red line, which runs at 0.8538. The pair is trading near 0.8517. Bulls and bears are likely to tussle for the closing price of the day and week near the psychologically important level of 0.8500. Given trader's disappointment with the ECB's rhetoric, as well as yesterday's bearish candlestick with a long upper shadow, the likelihood of a decline is high. It is better to wait for the convergence with the Tenkan line. After that, I would advise you to monitor bearish candlestick patterns on the weekly or smaller charts. If they appear, it will be a sell signal.

Have a wonderful weekend!

Ivan Aleksandrov,
Analytical expert of InstaTrade
© 2007-2025

Recommended Stories

EUR/USD. July 25th. The ECB Monitors EU–US Trade Negotiations

On Thursday, the EUR/USD pair traded sideways. The outcome of the ECB meeting had virtually no impact on market sentiment—and the meeting itself turned out to be uneventful

Samir Klishi 12:39 2025-07-25 UTC+2

Forecast for GBP/USD on July 25, 2025

On the hourly chart, the GBP/USD pair on Thursday rebounded from the 50.0% retracement level at 1.3579, reversed in favor of the U.S. dollar, and consolidated below the 61.8% Fibonacci

Samir Klishi 12:12 2025-07-25 UTC+2

Forex forecast 25/07/2025: EUR/USD, AUD/USD, USD/JPY, GBP/USD, Gold, Ethereum and Bitcoin

Useful links: My other articles are available in this section InstaForex course for beginners Popular Analytics Open trading account Important: The begginers in forex trading need to be very careful

Sebastian Seliga 11:02 2025-07-25 UTC+2

GBP/USD: The Pair is Forming a Trend Reversal Pattern – "Head and Shoulders"

The British pound remains under pressure due to the challenging economic situation in the United Kingdom. Recent economic data confirms this, which naturally affects demand for the sterling. Weak manufacturing

Pati Gani 09:57 2025-07-25 UTC+2

Trading Signals for GOLD (XAU/USD) for July 25-28, 2025: buy above $3,359 and sell below $3,392 (21 SMA - 6/8 Murray)

The Eagle Indicator is showing a negative signal, so if the price falls below 3,359, it is seen as a signal to sell with targets at the 5/8 Murray around

Dimitrios Zappas 08:01 2025-07-25 UTC+2

Trading Signals for BITCOIN for July 25-28, 2025: buy above $115,000 (5/8 Murray - 21 SMA)

Bitcoin is trading around $115,400 after reaching the key level of $115,000, and a technical rebound is likely imminent in the coming hours, reaching the 21SMA around $118,350. If Bitcoin

Dimitrios Zappas 07:59 2025-07-25 UTC+2

Trading Signals for EUR/USD for July 25-28, 2025: sell below 1.1741 (21 SMA - 8/8 Murray)

Early in the European session, the EUR/USD pair is trading around 1.174, undergoing a technical correction after attempting to break below the 1.1790 level. The euro is likely to continue

Dimitrios Zappas 07:57 2025-07-25 UTC+2

EUR/USD Forecast for July 25, 2025

At the very last moment, the euro released the tension and abandoned its attempt to retest the upper boundary of the price channel. The day closed below the daily MACD

Laurie Bailey 05:06 2025-07-25 UTC+2

GBP/USD Forecast for July 25, 2025

The British pound failed to overcome the pressure of the daily balance line. Yesterday, the price fell by 69 pips, and this decline continued into the morning. The signal line

Laurie Bailey 05:06 2025-07-25 UTC+2

USD/JPY Forecast for July 25, 2025

The USD/JPY pair is showing a strong upward trend. After rebounding from the support level at 146.29, the price is now heading toward the nearest target at 149.38. This movement

Laurie Bailey 05:06 2025-07-25 UTC+2
Can't speak right now?
Ask your question in the chat.
 

Dear visitor,

Your IP address shows that you are currently located in the USA. If you are a resident of the United States, you are prohibited from using the services of InstaFintech Group including online trading, online transfers, deposit/withdrawal of funds, etc.

If you think you are seeing this message by mistake and your location is not the US, kindly proceed to the website. Otherwise, you must leave the website in order to comply with government restrictions.

Why does your IP address show your location as the USA?

  • - you are using a VPN provided by a hosting company based in the United States;
  • - your IP does not have proper WHOIS records;
  • - an error occurred in the WHOIS geolocation database.

Please confirm whether you are a US resident or not by clicking the relevant button below. If you choose the wrong option, being a US resident, you will not be able to open an account with InstaTrade anyway.

We are sorry for any inconvenience caused by this message.