See also

 09.05.2023 07:03 AM
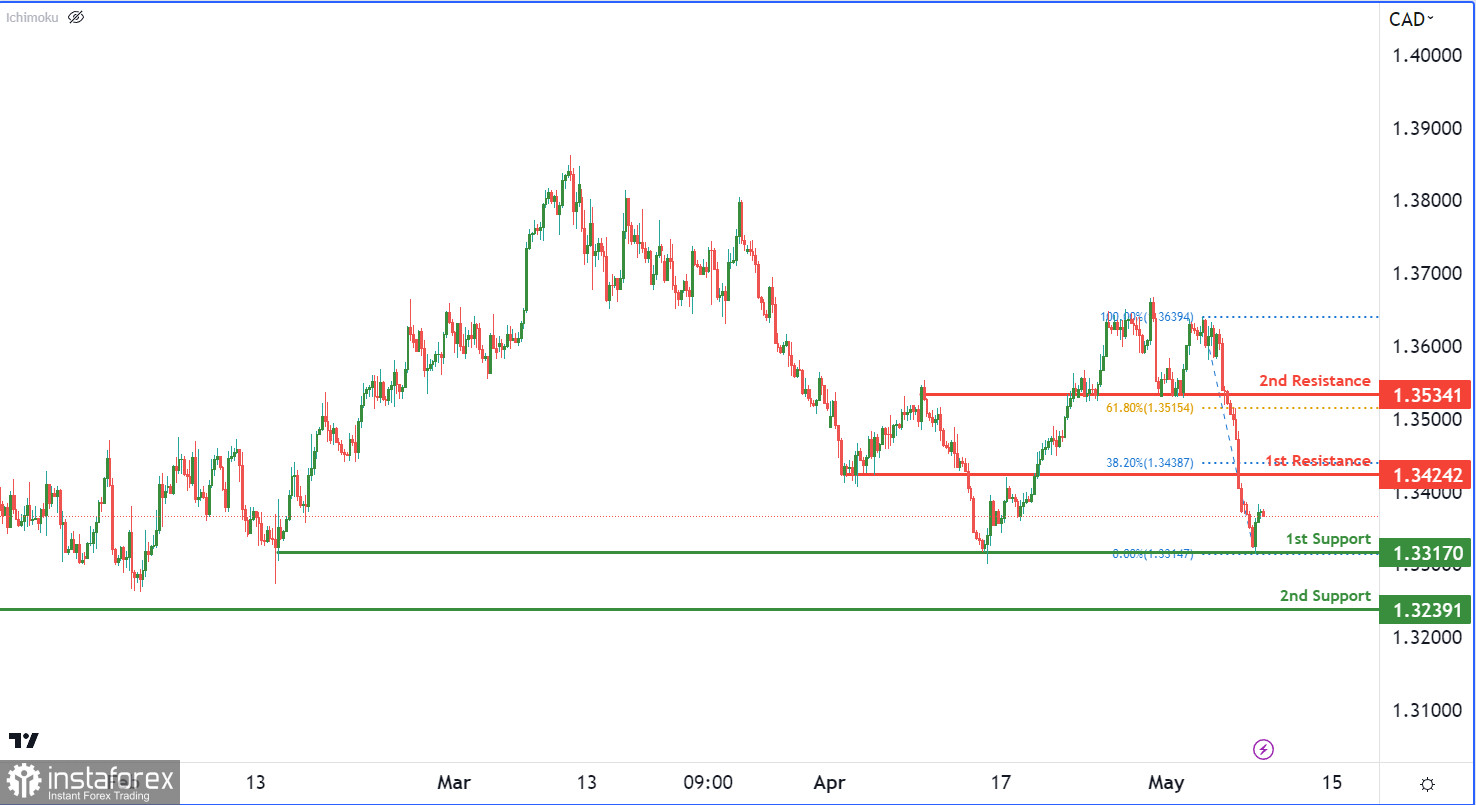
The USD/CAD chart indicates bullish momentum, with potential for further upward movement. The overall momentum is bullish, suggesting that prices could rise in the near future. A bullish continuation towards the 1st resistance level is possible. There are two support levels to monitor if prices fall: the multi-swing low support level at 1.3317 and the swing low support level at 1.3239. On the upside, two resistance levels are noteworthy: the pullback resistance level at 1.3424, which coincides with the 38.20% Fibonacci retracement level, and the pullback resistance level at 1.3534, which coincides with the 61.80% Fibonacci retracement level.
You have already liked this post today
*The market analysis posted here is meant to increase your awareness, but not to give instructions to make a trade.


