See also

 22.11.2023 03:58 PM
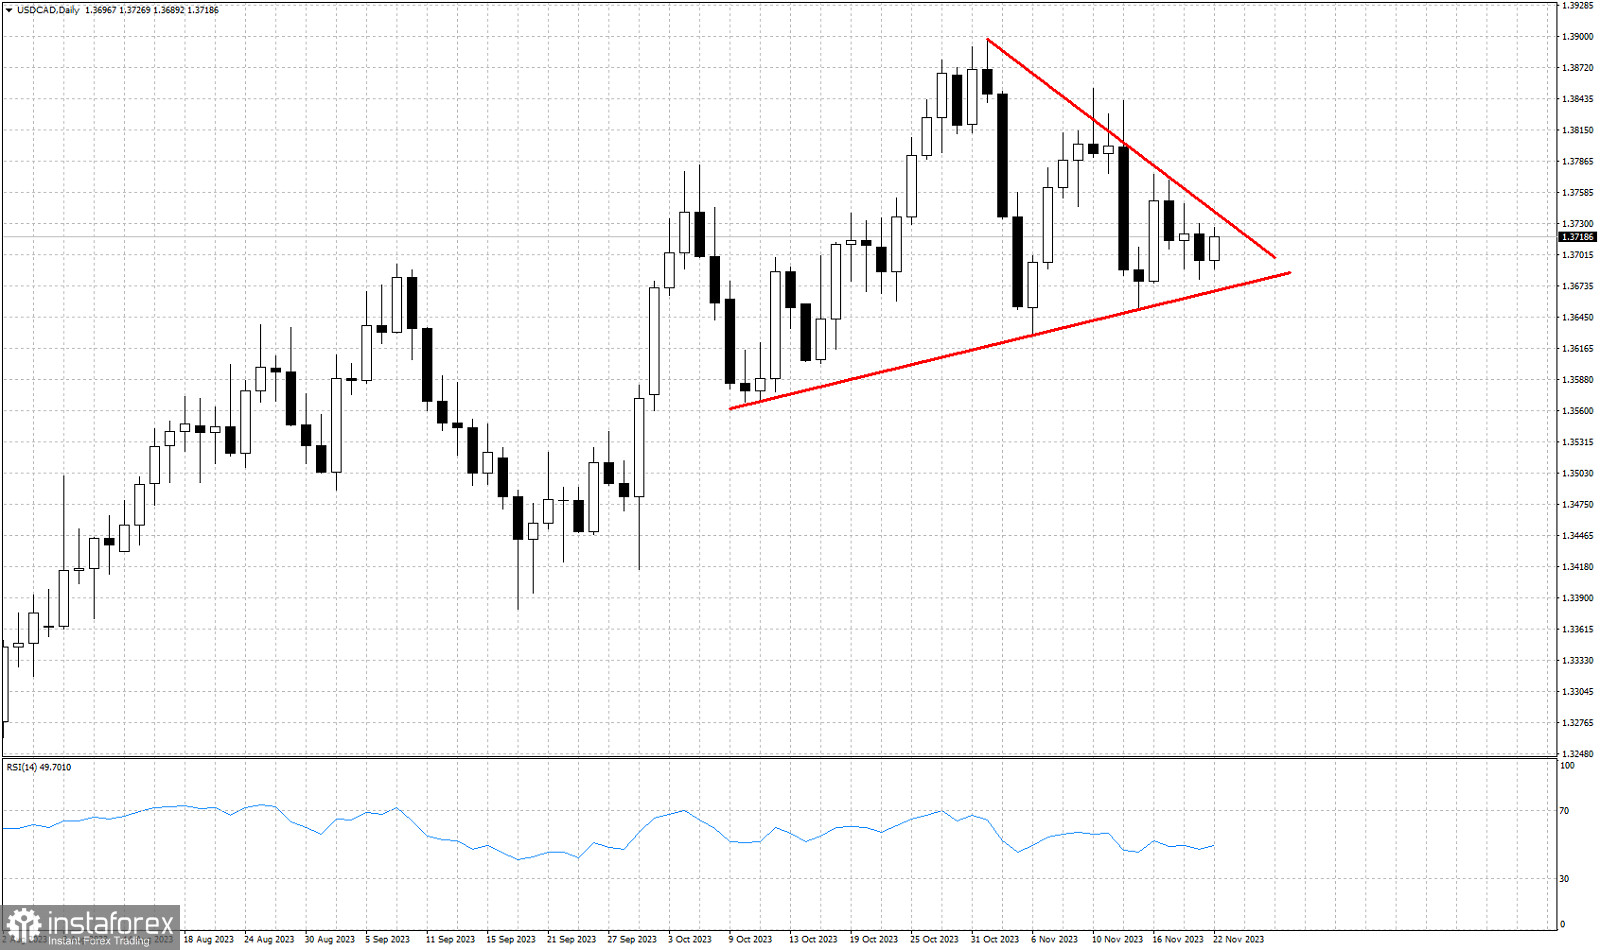
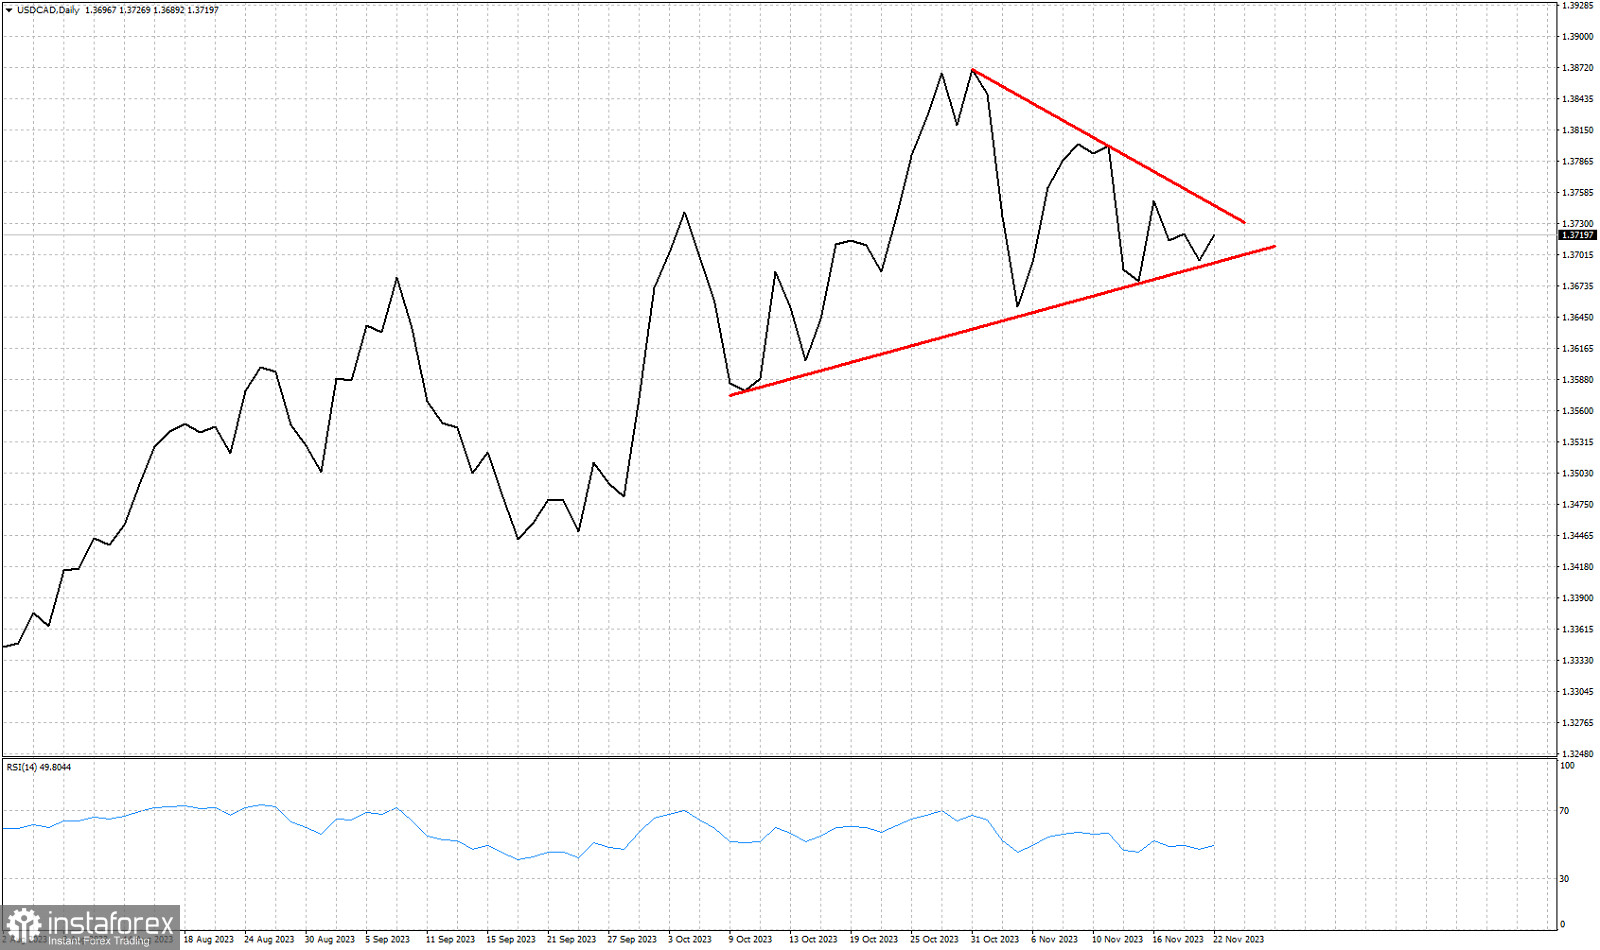
Red lines- triangle pattern
USDCAD is trading around 1.3730, Price has made little progress over the last 40 days. Price is at the same price level since the beginning of October. USDCAD has formed a triangle pattern with lower highs and higher lows. This consolidation is expected to end soon as there is very little space left inside the triangle.
Red lines- triangle pattern
Traders better remain patient and wait for a break out to occur before choosing sides. After an upward sloping trend, triangles usually break to the upside as a final thrust of the trend. Resistance in this case is the 1.3750 area. On the other hand a break below 1.3680-1.3670 would be a sign of weakness. The lower triangle boundary is at 1.3680-1.3670. Breaking below this level would be a bearish signal and a trend reversal signal, signalling that a top was made at 1.3897.
You have already liked this post today
*The market analysis posted here is meant to increase your awareness, but not to give instructions to make a trade.


