See also
The GBP/JPY pair dropped in the short term, which was natural after its strong leg higher. It could only test and retest the near term support levels before jumping higher again. The price is located at 187.56 at the time of writing. The bias remains bullish despite the current drop as the Yen Futures maintain a bearish outlook.
Fundamentally, the BOJ Core CPI reported only a 3.0% growth even if the traders expected a 3.4% growth. On the other hand, the UK BRC Shop Price Index increased by 4.3% less compared to 5.2% growth in the previous reporting period.
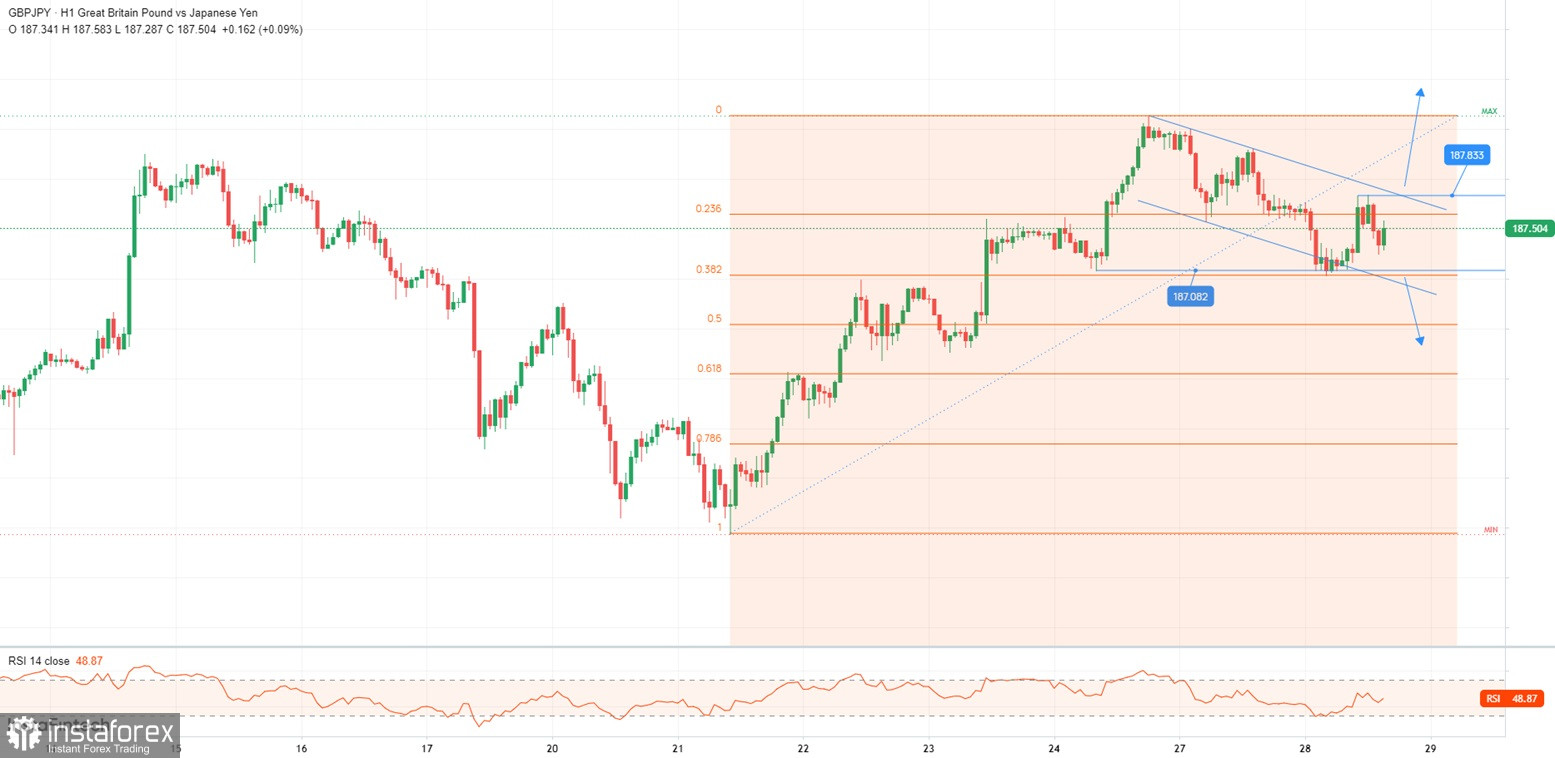
From the technical point of view, the GBP/JPY pair dropped within a down channel (flag pattern). This could represent a bullish formation.
It has found support on the 38.2% retracement level (187.03) and has now turned to the upside again. False breakdowns below 187.08 signaled exhausted sellers. Now, the instrument is challenging the 23.6% Fibonacci level (187.65). The downtrend line and 187.83 represent upside obstacles.
Testing and retesting the flag's resistance and registering false breakouts should announce a new sell-off. Still, only a bearish closure below 187.00 activates more declines and is seen as a selling opportunity.
Jumping and closing above the downtrend line and above 187.83 validates upward movement. This brings new longs.
You have already liked this post today
*The market analysis posted here is meant to increase your awareness, but not to give instructions to make a trade.
Analysis of Wednesday's Trades 1H Chart of GBP/USD On Wednesday, the GBP/USD pair continued a weak downward movement, which is based purely on technical factors. While there was no macroeconomic
Analysis of Wednesday's Trades 1H Chart of EUR/USD On Wednesday, the EUR/USD currency pair continued to move with minimal volatility and without a clear direction. More precisely, there
On Wednesday, the GBP/USD pair continued a weak downward move, which has a corrective character. The price consolidated below the ascending trendline, so the decline was expected. A decline
Analysis of Tuesday's Trades 1H Chart of GBP/USD On Tuesday, the GBP/USD pair traded with a slight decline, which was not triggered by any events or reports. The ascending trendline
Analysis of Tuesday's Trades 1H Chart of EUR/USD On Tuesday, the EUR/USD pair traded intraday in both directions with minimal volatility. The macroeconomic and fundamental background remains absent, leaving
The EUR/USD currency pair continued to trade on Tuesday with minimal volatility, without support from macroeconomic or fundamental background, and strictly sideways. As we expected, the U.S. construction sector reports
The GBP/USD currency pair on Tuesday generally maintained the downward tendency of recent days. Unlike EUR/USD, GBP/USD is showing at least some movement. Naturally, this movement is corrective. A consolidation
Analysis of Monday's Trades 1H Chart of GBP/USD On Monday, the GBP/USD pair also traded lower and broke through its ascending trendline. After two weeks of growth, a technical correction
Analysis of Monday's Trades 1H Chart of EUR/USD On Monday, the EUR/USD currency pair began a new wave of decline, which had nothing to do with fundamentals or macroeconomics. During
Training video
Your IP address shows that you are currently located in the USA. If you are a resident of the United States, you are prohibited from using the services of InstaFintech Group including online trading, online transfers, deposit/withdrawal of funds, etc.
If you think you are seeing this message by mistake and your location is not the US, kindly proceed to the website. Otherwise, you must leave the website in order to comply with government restrictions.
Why does your IP address show your location as the USA?
Please confirm whether you are a US resident or not by clicking the relevant button below. If you choose the wrong option, being a US resident, you will not be able to open an account with InstaTrade anyway.
We are sorry for any inconvenience caused by this message.