empty
02.07.2024 09:21 AM
EUR/USD and GBP/USD: Technical analysis on July 2

EUR/USD

This image is no longer relevant

Higher timeframes

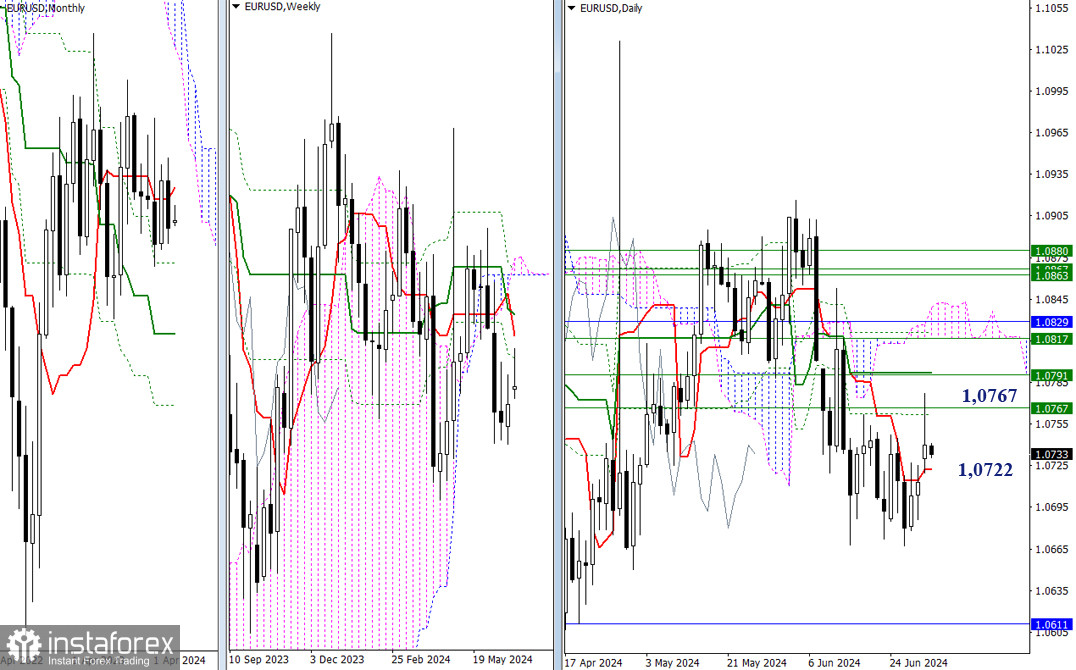
Yesterday, the pair tested the resistance around 1.0767 (weekly and monthly Fibonacci Kijuns), but as a result, there was a long upper shadow. The bulls' weakness may lie in the fact that the bears could completely neutralize the bullish activity at the beginning of the week, manage to close the bullish gap formed at the opening level, and reclaim the support of the intraday short-term trend (1.0722). After this, the focus will shift to two bearish targets: the nearest low (1.0667) and the monthly support (1.0611). The bulls can prevent this scenario from unfolding by returning EUR/USD to the resistance area (1.0767) and have the price consolidate above this mark.

This image is no longer relevant

H4 – H1

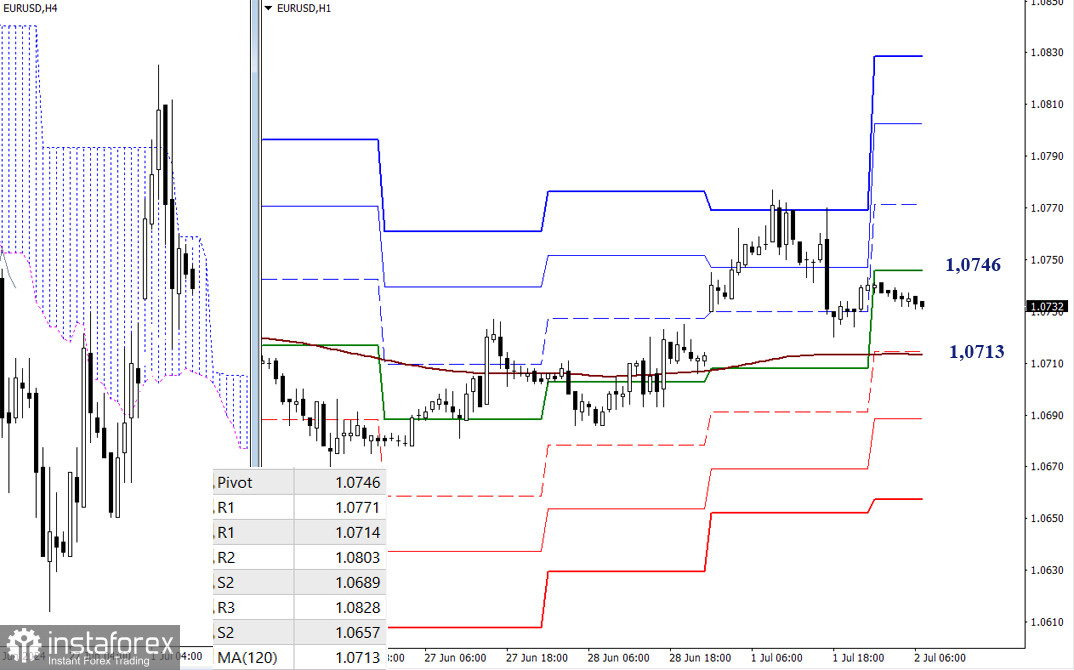
Yesterday, the pair stopped rising by the final resistance of the classic Pivot levels. Under these conditions, the bulls still have the advantage, but the pair is in a deep correction, with the nearest support being the weekly long-term trend (1.0713). Breaking and reversing this trend could change the current balance of power. In order to continue the downward movement within the day, additional support levels are found at 1.0689 and 1.0657 (classic Pivot levels). If the bulls want to prepare in advance, they will need to restore their positions and work on the pair's upward movement during the day. To do so, the price must overcome the resistances of the classic Pivot levels (1.0746 - 1.0771 - 1.0803 - 1.0828).

***

GBP/USD

This image is no longer relevant

Higher timeframes

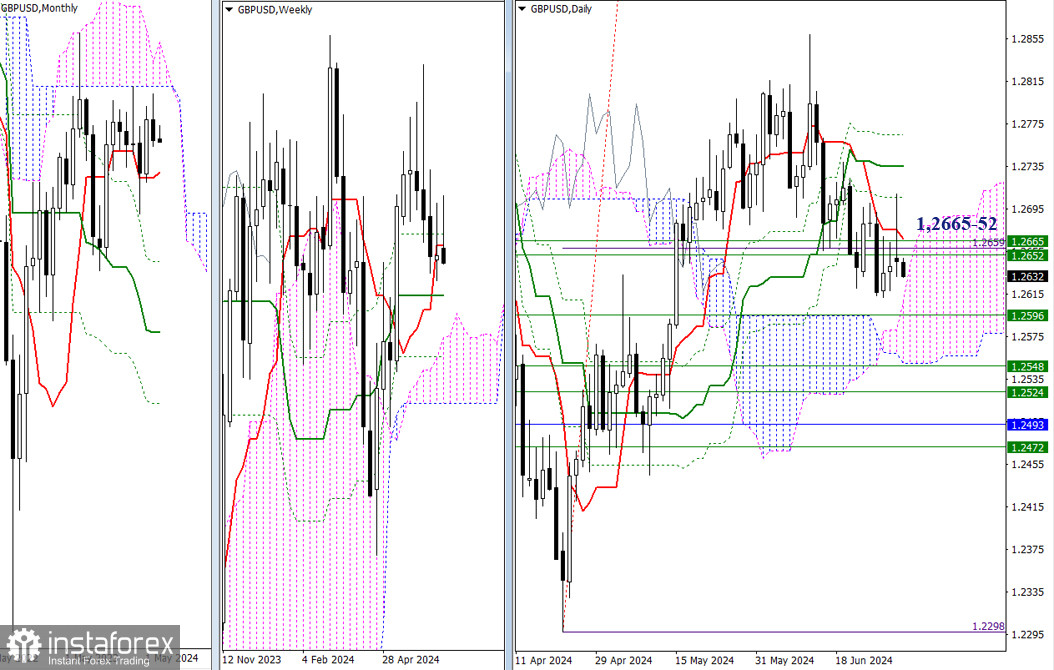
The pound, having cast a long upper shadow and reached the daily resistance (1.2706), returned below the weekly levels (1.2652-65) by the end of the day. In order to support the bearish bias, the pair needs to exit the current corrective zone and meet the nearest supports around 1.2608 – 1.2596 (the upper boundary of the daily cloud + the weekly medium-term trend). Meanwhile, the bulls need to take control of the weekly levels (1.2652-65), consolidate above them, and move away from their area of influence.

This image is no longer relevant

H4 – H1

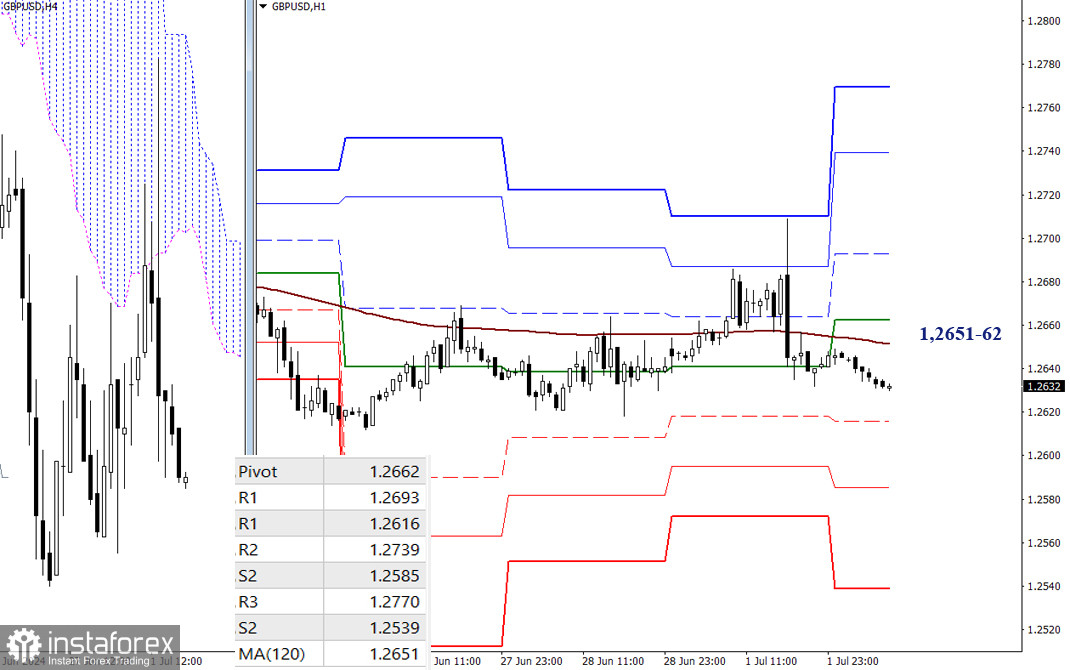
The key levels on the lower timeframes are 1.2651 (weekly long-term trend) and 1.2662 (central Pivot level of the day), positioned near the most critical levels of the higher timeframes (1.2652-65). Therefore, all conclusions and expectations mentioned above have been confirmed on the lower timeframes. The bears must keep the GBP/USD below these levels. Increased bearish sentiment will progress throughout the day through the supports of the classic Pivot levels (1.2616 – 1.2585 – 1.2539). The bulls will gain an advantage if the pound breaks the key levels (1.2651-62) and firmly consolidates above them. To support the upward movement, the targets will be the resistances of the classic Pivot levels (1.2693 – 1.2739 – 1.2770).

***

The technical analysis of the situation uses:

Higher timeframes - Ichimoku Kinko Hyo (9.26.52) + Fibonacci Kijun levels

Lower timeframes - H1 - Pivot Points (classic) + Moving Average 120 (weekly long-term trend)

Evangelos Poulakis,
Analytical expert of InstaTrade
© 2007-2025

Recommended Stories

Forecast for EUR/USD on August 13, 2025

On Tuesday, the EUR/USD pair continued its upward movement after rebounding from the 50.0% retracement level at 1.1590. It also consolidated above the resistance zone of 1.1637–1.1645 and reached

Samir Klishi 11:56 2025-08-13 UTC+2

Forecast for GBP/USD on August 13, 2025

On the hourly chart, the GBP/USD pair on Tuesday once again rebounded from the support zone of 1.3416–1.3425 and turned in favor of the pound, subsequently consolidating above the 76.4%

Samir Klishi 11:48 2025-08-13 UTC+2

GBP/USD. Indicator Analysis on August 13, 2025

On Tuesday, the pair moved upward to the 85.4% retracement level at 1.3522 (red dotted line), then declined, closing the daily candle at 1.3495. Today, it may continue moving upward

Stefan Doll 11:45 2025-08-13 UTC+2

EUR/USD. Indicator Analysis on August 13, 2025

On Tuesday, the pair moved upward on news, reached the 1.1698 fractal (yellow dotted line), then declined, closing the daily candle at 1.1673. Today it may continue moving upward

Stefan Doll 11:38 2025-08-13 UTC+2

XAU/USD remains under pressure, although there is limited potential for strengthening. Wednesday, August 13, 2025.

[XAU/USD] – [Wednesday, August 13, 2025] XAU/USD appears to be attempting to test its nearest support level, as confirmed by the RSI (14) indicator, which is in the Neutral-Bearish area

Arief Makmur 08:25 2025-08-13 UTC+2

Despite the potential for a downward correction, the AUD/USD remains in strengthen bias condition. Wednesday, August 13, 2025.

[AUD/USD] – [Wednesday, August 13, 2025] With the AUD/USD position which have EMA(50) still above the EMA(200) level and the RSI (140) in the neutral-bullish zone, the bias for this

Arief Makmur 08:25 2025-08-13 UTC+2

EUR/USD forecast for August 13, 2025

Yesterday, the euro once again attempted to test the balance line resistance. This time, it was supported by external markets — the S&P 500 rose by 1.14% and even

Laurie Bailey 05:00 2025-08-13 UTC+2

GBP/USD forecast for August 13, 2025

Yesterday, the British pound took full advantage of the temporary weakness in the dollar, reaching the second intermediate level of 1.3525. The Marlin oscillator is rising in the territory

Laurie Bailey 05:00 2025-08-13 UTC+2

Silver forecast for August 13, 2025

Yesterday, silver gained 0.41%. The price has returned above the balance indicator line, and the Marlin oscillator, which is close to moving into the territory of an upward trend

Laurie Bailey 04:59 2025-08-13 UTC+2

Trading Signals for GOLD (XAU/USD) for August 12-15, 2025: buy above $3,341 or sell below $3,335 (21 SMA - 200 EMA)

If gold falls below 3,340, the outlook could be negative. It could then resume its downward movement, and we could expect the instrument to reach 5/8 Murray at 3,320

Dimitrios Zappas 13:34 2025-08-12 UTC+2
Can't speak right now?
Ask your question in the chat.
 

Dear visitor,

Your IP address shows that you are currently located in the USA. If you are a resident of the United States, you are prohibited from using the services of InstaFintech Group including online trading, online transfers, deposit/withdrawal of funds, etc.

If you think you are seeing this message by mistake and your location is not the US, kindly proceed to the website. Otherwise, you must leave the website in order to comply with government restrictions.

Why does your IP address show your location as the USA?

  • - you are using a VPN provided by a hosting company based in the United States;
  • - your IP does not have proper WHOIS records;
  • - an error occurred in the WHOIS geolocation database.

Please confirm whether you are a US resident or not by clicking the relevant button below. If you choose the wrong option, being a US resident, you will not be able to open an account with InstaTrade anyway.

We are sorry for any inconvenience caused by this message.