empty
13.08.2024 11:23 AM
EUR/USD and GBP/USD: technical analysis for August 13

EUR/USD

This image is no longer relevant

Higher timeframes

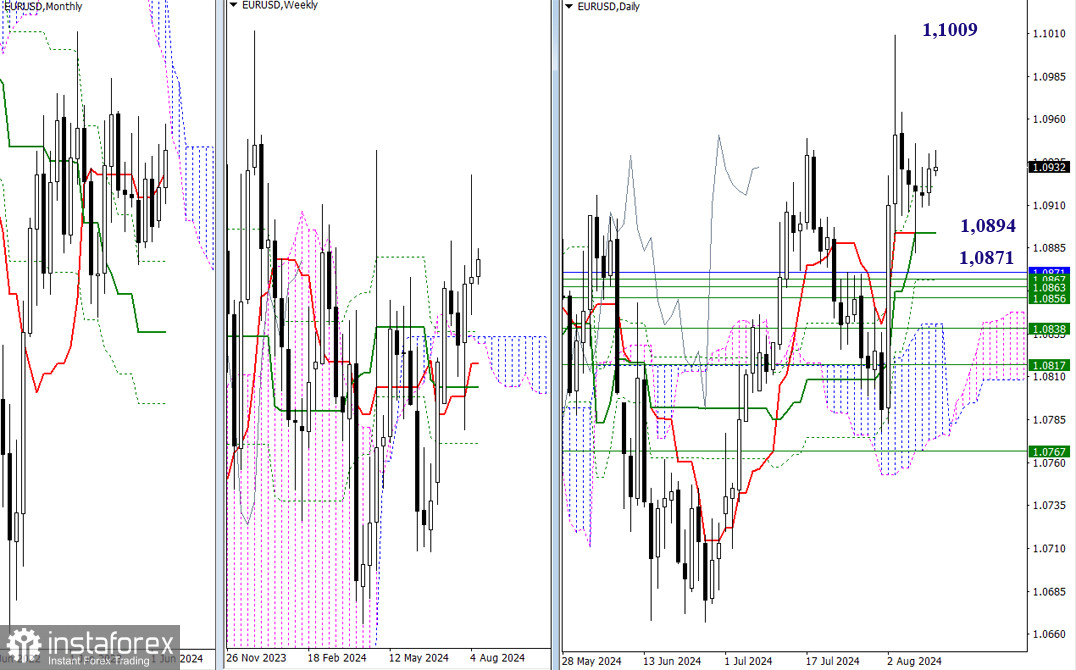
No major changes have been recorded over the past 24 hours. The EUR/USD pair remains within the current consolidation range. All previously indicated crucial levels have retained their positions. For bullish traders, it is crucial to test and overcome the nearest high at 1.1009 under the current market conditions. For bearish traders, two key levels might be significant in the near term: 1.0894 (the convergence of key daily Ichimoku levels) and 1.0871 (the monthly short-term trend, reinforcing the area of weekly support levels).

This image is no longer relevant

H4 – H1

Lower timeframes

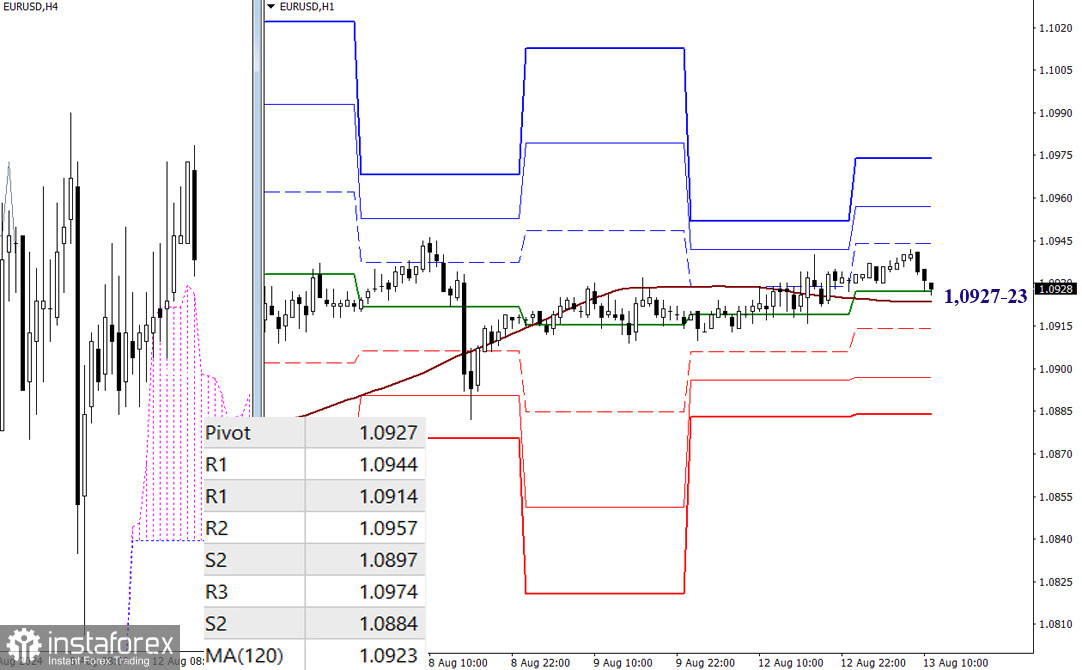
Bullish traders continue to hold the upper hand on lower timeframes, as EUR/USD is trading above key levels situated close to each other: 1.0927 (the central daily Pivot level) and 1.0923 (the weekly long-term trend). However, the market is currently in a correction phase and testing key levels. The outcome of this bullish sequence could alter the existing balance of power. Should a directional movement develop, classic pivot levels may come into play. In this case, bearish traders will encounter support at 1.0914 – 1.0897 – 1.0884, while bullish traders will face resistance at 1.0944 – 1.0957 – 1.0974.

GBP/USD

This image is no longer relevant

Higher timeframes

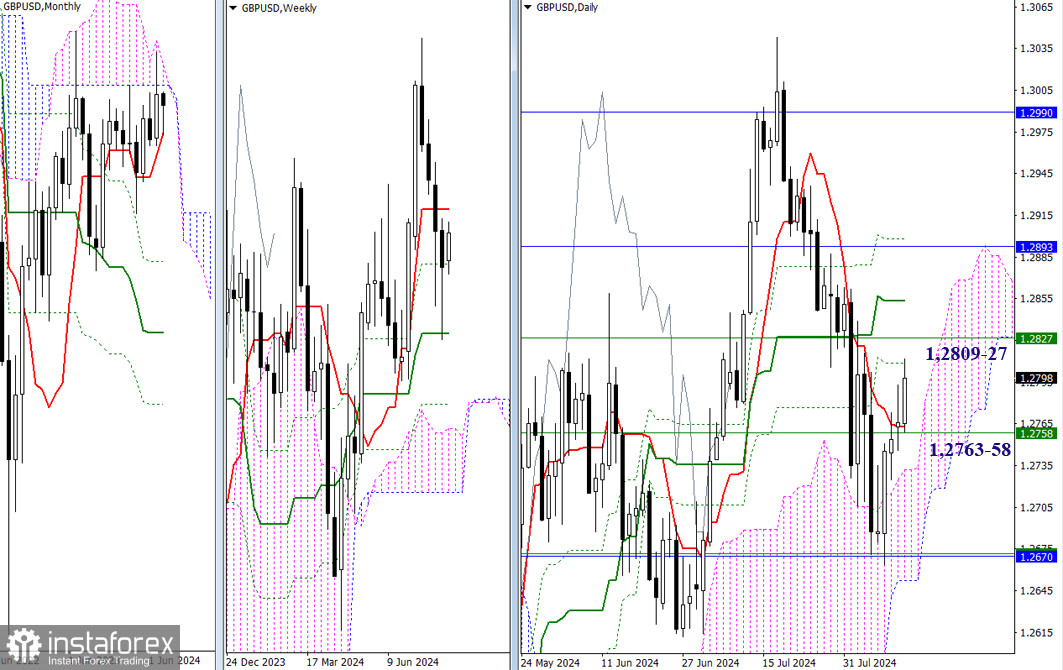
The daily short-term trend (1.2763) has not been able to halt the upward correction. EUR/USD is extending its rise. The instrument has begun testing the next resistances of the daily Ichimoku dead cross. The current level is Fib Kijun (1.2809). Bullish traders are looking ahead to 1.2827 (the weekly short-term trend), 1.2853 (the daily medium-term trend), and 1.2893-98 (the lower border of the monthly cloud + the final level of the daily cross).

This image is no longer relevant

H4 – H1

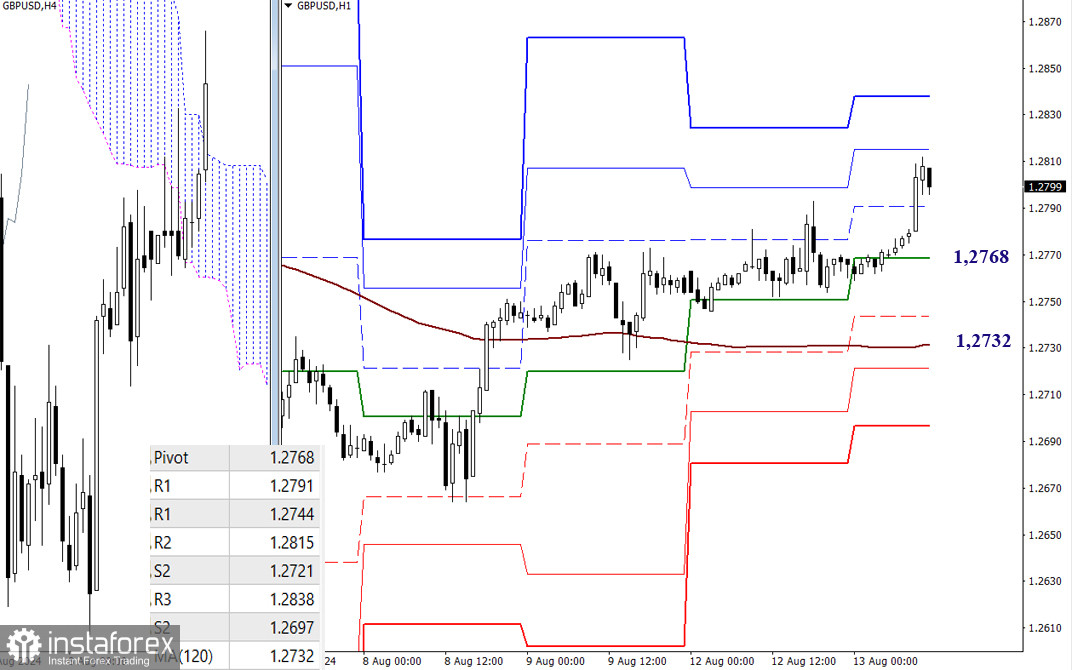
Bullish traders hold the advantage on lower timeframes as well, driving the rise. Currently, they are testing the influence zone of the second resistance of the classic pivot levels (1.2815). The next bullish target remains the resistance R3 (1.2838). If priorities are revised and a corrective decline develops, the main focus will be the interaction with key lower timeframe levels, currently noted at 1.2768 (the central pivot level) and 1.2732 (the weekly long-term trend). A breakout and reversal of the trend could change the existing balance of power.

***

This technical analysis is based on the following ideas:

Larger timeframes - Ichimoku Kinko Hyo (9.26.52) + Fibo Kijun levels

H1 – classic pivot points + 120-period Moving Average (weekly long-term trendline)

Evangelos Poulakis,
Analytical expert of InstaTrade
© 2007-2025

Recommended Stories

Forecast for EUR/USD on August 11, 2025

On Friday, EUR/USD made two rebounds from the 1.1637–1.1645 support zone and turned in favor of the euro. This means the upward movement could continue today toward the 76.4% Fibonacci

Samir Klishi 10:44 2025-08-11 UTC+2

Forecast for GBP/USD on August 11, 2025

On the hourly chart, GBP/USD on Friday made two rebounds from the 1.3425 level, and on Monday continues moving upward toward the 76.4% retracement level at 1.3470. A rebound from

Samir Klishi 10:25 2025-08-11 UTC+2

Forex forecast 11/08/2025: EUR/USD, USD/JPY, GBP/USD, Gold, Ethereum and Bitcoin

Useful links: My other articles are available in this section InstaForex course for beginners Popular Analytics Open trading account Important: The begginers in forex trading need to be very careful

Sebastian Seliga 10:20 2025-08-11 UTC+2

GBP/USD. Technical Analysis for the Week of August 11–16

Trend Analysis This week, from the 1.3450 level (close to the last weekly candle), the price may start moving downward toward 1.3270 – a historical support level (blue dotted line)

Stefan Doll 10:02 2025-08-11 UTC+2

EUR/USD. Technical Analysis for the Week of August 11–16

Last week, the pair moved upward, almost testing the historical resistance level at 1.1710 (blue dotted line), and then turned downward, closing the weekly candle at 1.1641. In the coming

Stefan Doll 09:55 2025-08-11 UTC+2

GBP/USD. Indicator Analysis on August 11, 2025

On Friday, the pair moved downward, tested the 61.8% retracement level at 1.3416 (red dotted line), and then rose, closing the daily candle at 1.3450. Today, the price will attempt

Stefan Doll 09:53 2025-08-11 UTC+2

EUR/USD. Indicator Analysis on August 11, 2025

On Friday, the pair moved downward, almost testing the 23.6% retracement level at 1.1626 (blue dotted line), after which the price rose slightly and closed the daily candle at 1.1641

Stefan Doll 09:40 2025-08-11 UTC+2

If the USD/JPY successfully breaks through the Pivot level, it has the potential to continue strengthening. Monday, August 11, 2025.

[USD/JPY] – [Monday, August 11, 2025] Although the condition of USD/JPY is still moving sideways, as indicated by the overlapping EMAs, the USD/JPY's successful breakout and close above its Pivot

Arief Makmur 07:37 2025-08-11 UTC+2

NZD/USD still has the opportunity to continue strengthening to its nearest resistance level. Monday, August 11, 2025.

[NZD/USD] – [Monday, August 11, 2025] With both EMAs forming a Golden Cross and the RSI(14) indicator at the Neutral Bullish level, the Kiwi has the potential to strengthen today

Arief Makmur 07:37 2025-08-11 UTC+2

EUR/USD Forecast for August 11, 2025

The euro has settled even more firmly at the 1.1632 support level. The longer it consolidates there, the more balanced the probabilities of growth and decline will become. However

Laurie Bailey 05:01 2025-08-11 UTC+2
Can't speak right now?
Ask your question in the chat.
 

Dear visitor,

Your IP address shows that you are currently located in the USA. If you are a resident of the United States, you are prohibited from using the services of InstaFintech Group including online trading, online transfers, deposit/withdrawal of funds, etc.

If you think you are seeing this message by mistake and your location is not the US, kindly proceed to the website. Otherwise, you must leave the website in order to comply with government restrictions.

Why does your IP address show your location as the USA?

  • - you are using a VPN provided by a hosting company based in the United States;
  • - your IP does not have proper WHOIS records;
  • - an error occurred in the WHOIS geolocation database.

Please confirm whether you are a US resident or not by clicking the relevant button below. If you choose the wrong option, being a US resident, you will not be able to open an account with InstaTrade anyway.

We are sorry for any inconvenience caused by this message.