empty
04.11.2024 06:51 AM
GOLD – Technical Analysis

GOLD

This image is no longer relevant

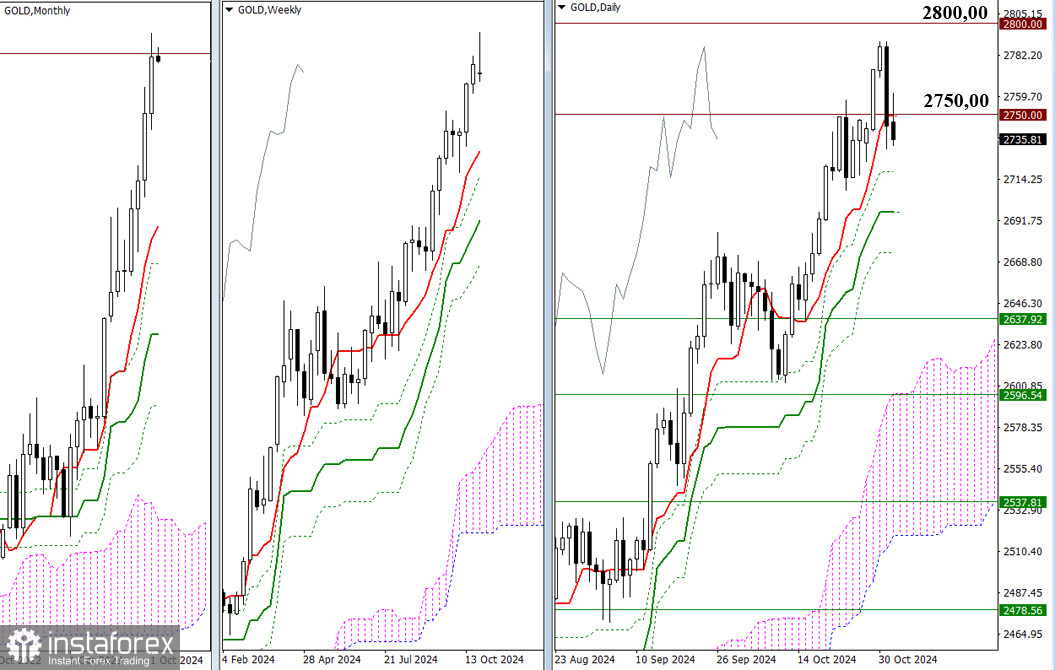
On Friday, the weekly result was marked by an uncertainty candle with an extended upper shadow. It is possible that the bears found a good spot for a corrective decline, as the bulls failed to reach 2800.00 and closed October below the psychological level of 2750.00, which had been actively tested throughout the second half of the month. It should be noted that the bears secured support from the daily short-term trend (2748.92), which is now defending their interests. If a decline develops, the primary task for the bears at this section of the chart will be to test, break, and eliminate the daily golden cross, which currently can be marked at levels 2718.28 – 2696.24 – 2674.21.

For the bulls, the nearest prospects maintain their relevance and position. New bullish opportunities may arise only after the 2750.00 level is broken and the resistance zone 2800.00 is tested and overcome.
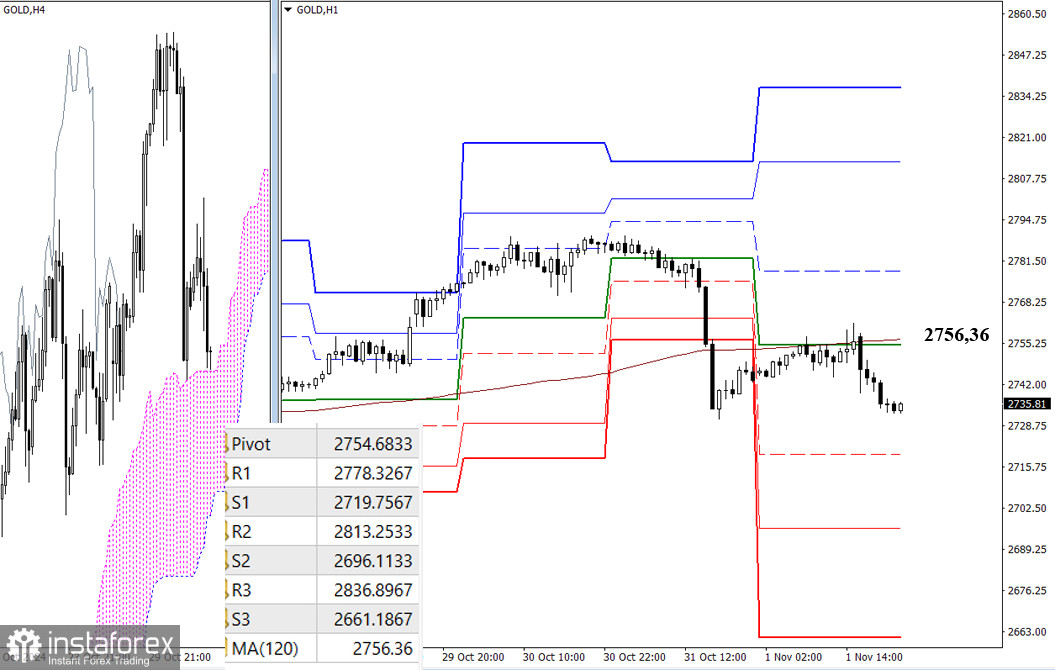
This image is no longer relevant

H4 – H1

On the lower time frames, the pair tested the weekly long-term trend (2756.36) from below on Friday, with the bears managing to defend their advantage and remain below the trend. Soon, it will be necessary for the bears to break through the H4 cloud, exit, and secure a position in the bearish zone relative to the cloud. If the cloud break is realized, additional downward targets on the lower timeframes, including the supports of the classic Pivot levels, will be added with the newly formed target for the H4 cloud breakout. If the bulls use the cloud's support and push off from it, simultaneously gaining the weekly long-term trend, then the intraday market focus will shift to the resistances of the classic Pivot levels. On the higher time frames, bulls will again aim to conquer 2750.00 and reach 2800.00.

Updated classic Pivot level values for guidance will appear when trading opens at the start of the new workweek.


Technical Analysis Components:

  • Higher Time Frames – Ichimoku Kinko Hyo (9.26.52) + Fibo Kijun levels
  • H1 – Classic Pivot Points + 120-period Moving Average (weekly long-term trend)
Evangelos Poulakis,
Analytical expert of InstaTrade
© 2007-2025

Recommended Stories

XAU/USD remains under pressure, although there is limited potential for strengthening. Wednesday, August 13, 2025.

[XAU/USD] – [Wednesday, August 13, 2025] XAU/USD appears to be attempting to test its nearest support level, as confirmed by the RSI (14) indicator, which is in the Neutral-Bearish area

Arief Makmur 08:25 2025-08-13 UTC+2

Despite the potential for a downward correction, the AUD/USD remains in strengthen bias condition. Wednesday, August 13, 2025.

[AUD/USD] – [Wednesday, August 13, 2025] With the AUD/USD position which have EMA(50) still above the EMA(200) level and the RSI (140) in the neutral-bullish zone, the bias for this

Arief Makmur 08:25 2025-08-13 UTC+2

EUR/USD forecast for August 13, 2025

Yesterday, the euro once again attempted to test the balance line resistance. This time, it was supported by external markets — the S&P 500 rose by 1.14% and even

Laurie Bailey 05:00 2025-08-13 UTC+2

GBP/USD forecast for August 13, 2025

Yesterday, the British pound took full advantage of the temporary weakness in the dollar, reaching the second intermediate level of 1.3525. The Marlin oscillator is rising in the territory

Laurie Bailey 05:00 2025-08-13 UTC+2

Silver forecast for August 13, 2025

Yesterday, silver gained 0.41%. The price has returned above the balance indicator line, and the Marlin oscillator, which is close to moving into the territory of an upward trend

Laurie Bailey 04:59 2025-08-13 UTC+2

Trading Signals for GOLD (XAU/USD) for August 12-15, 2025: buy above $3,341 or sell below $3,335 (21 SMA - 200 EMA)

If gold falls below 3,340, the outlook could be negative. It could then resume its downward movement, and we could expect the instrument to reach 5/8 Murray at 3,320

Dimitrios Zappas 13:34 2025-08-12 UTC+2

Trading Signals for EUR/USD for August 12-15, 2025: sell below 1.1647 (200 EMA - 7/8 Murray)

The euro is trading around 1.1618, above the 200 EMA and above the 6/8 Murray, recovering some of the previous day's losses but showing signs of exhaustion. If the euro

Dimitrios Zappas 13:34 2025-08-12 UTC+2

XAU/USD. Analysis and Forecast

From a technical standpoint, gold is managing to hold above the 200-period Simple Moving Average (SMA) on the 4-hour chart, which serves as a key support level. Given that oscillators

Irina Yanina 12:57 2025-08-12 UTC+2

Forecast for EUR/USD on August 12, 2025

On Monday, the EUR/USD pair declined to the 50.0% retracement level at 1.1590 and rebounded from it. As a result, a reversal in favor of the euro was completed

Samir Klishi 11:46 2025-08-12 UTC+2

Forecast for GBP/USD on August 12, 2025

On the hourly chart, GBP/USD on Monday declined to the support area of 1.3416–1.3425 and reversed near it in favor of the pound. This resumed the upward movement toward

Samir Klishi 11:23 2025-08-12 UTC+2
Can't speak right now?
Ask your question in the chat.
 

Dear visitor,

Your IP address shows that you are currently located in the USA. If you are a resident of the United States, you are prohibited from using the services of InstaFintech Group including online trading, online transfers, deposit/withdrawal of funds, etc.

If you think you are seeing this message by mistake and your location is not the US, kindly proceed to the website. Otherwise, you must leave the website in order to comply with government restrictions.

Why does your IP address show your location as the USA?

  • - you are using a VPN provided by a hosting company based in the United States;
  • - your IP does not have proper WHOIS records;
  • - an error occurred in the WHOIS geolocation database.

Please confirm whether you are a US resident or not by clicking the relevant button below. If you choose the wrong option, being a US resident, you will not be able to open an account with InstaTrade anyway.

We are sorry for any inconvenience caused by this message.