empty
02.12.2024 05:16 AM
USD/JPY and EUR/JPY – Weekly and Monthly Summary

USD/JPY

This image is no longer relevant

Higher Timeframes:

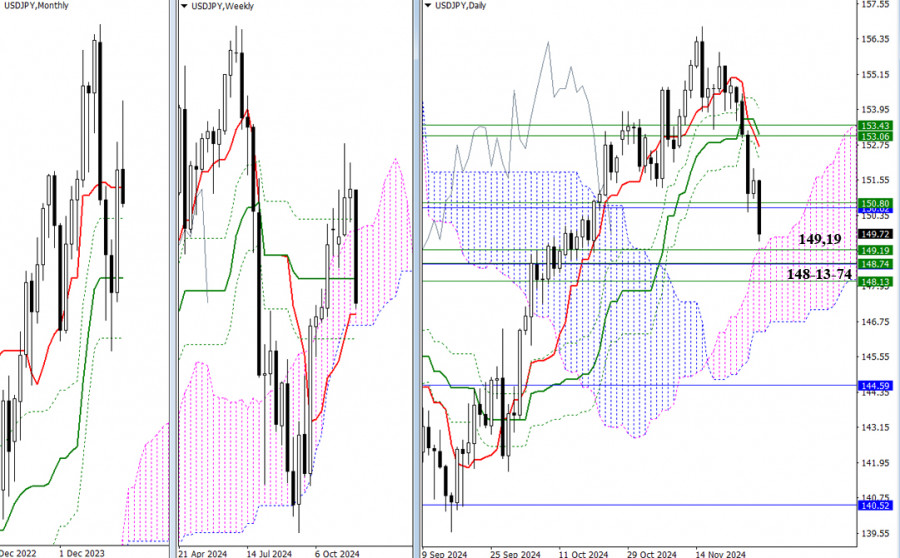
Last week delivered a significant bearish outcome. Gains achieved over several weeks, during which bulls attempted to regain control and continue the upward movement, were erased and are now history. Several strong support levels currently block further bearish progress, forming a zone within 149.19 – 148.74 – 148.13 (weekly short-term trend, lower boundary of the Ichimoku weekly cloud, and Fibonacci Kijun levels for the week and month). A breakout below this zone would open new bearish perspectives, such as a decline toward the lower boundary of the daily Ichimoku cloud (146.74) and the formation of a daily target. Beyond this, attention would drop toward the monthly medium-term trend (144.59).

If a rebound occurs, the yen is likely first to attempt to reclaim the nearest resistance at 150.78 (weekly medium-term trend + monthly short-term trend) and then aim for the levels of the daily cross strengthened by weekly resistances (153.06 – 153.43).

In addition to the weekly performance, the November monthly candle closed with a distinctly bearish character, suggesting sustained downward momentum and further strengthening of bearish sentiment.

***

EUR/JPY

This image is no longer relevant

Higher Timeframes:

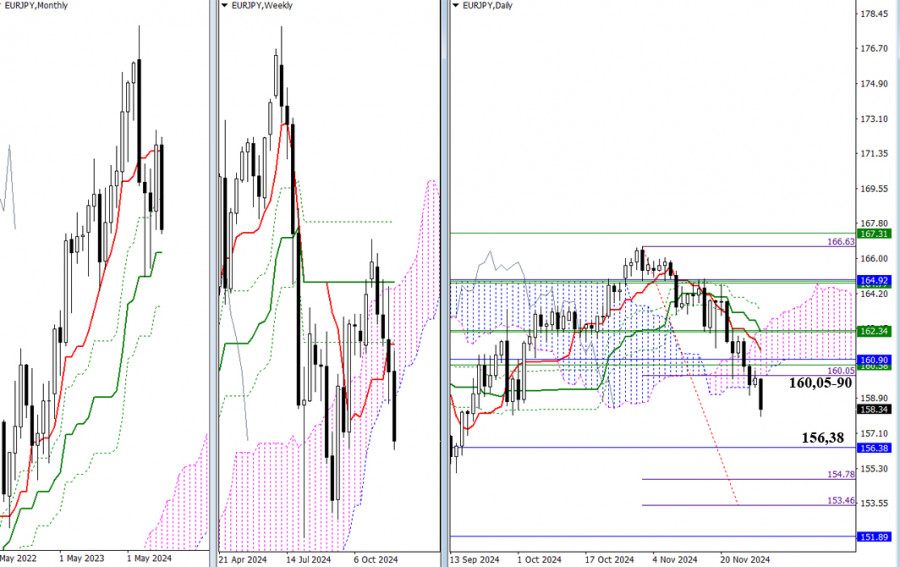
November ended with a rebound from the monthly short-term trend (164.87), marking a strong performance by the bears. On the weekly timeframe, the bears successfully exited the cloud region (160.05) and closed the week firmly in bearish territory relative to the Ichimoku cloud. The next task is to confirm this result and form a weekly target for breaking through the Ichimoku cloud.

In the daily timeframe, bears also managed to exit the cloud and establish a daily target for a break below the Ichimoku cloud (154.78 – 153.46). Beyond the daily target, the bearish focus would shift to monthly supports at 156.38 – 151.89 in the event of further decline.

Should sentiment shift, bulls would aim to restore their positions by returning to the Ichimoku cloud (160.05) and moving toward its upper boundaries on the daily (164.61) and weekly (162.98) timeframes. Within the cloud, resistance levels of the daily death cross, currently located at 161.29 (Tenkan) and 162.31 (Kijun), are also notable. As the pair rises, these targets will be tested for strength, and overcoming them with a reliable consolidation above would open new bullish prospects.

***

Technical Tools Used for Analysis:

  • Higher Timeframes: Ichimoku Kinko Hyo (9.26.52) + Fibonacci Kijun levels
  • H1 Timeframe: Pivot Points (classic) + Moving Average 120 (weekly long-term trend)
Evangelos Poulakis,
Analytical expert of InstaTrade
© 2007-2025

Recommended Stories

Trading Signals for BITCOIN for August 25-29, 2025: buy above $110,600 (rebound - 21 SMA)

Bitcoin reached a low of $110,600 during the morning session in the US, forming a double bottom pattern. It is expected to reach the resistance zone of $114,260

Dimitrios Zappas 17:39 2025-08-25 UTC+2

Trading Signals for EUR/USD for August 25-29, 2025: sell below 1.1745 (200 EMA - 8/8 Murray)

A consolidation at 1.1780 is needed above this level for a bullish outlook. So, the euro could then reach the level of 1.1829 and even the psychological level of 1.20

Dimitrios Zappas 17:32 2025-08-25 UTC+2

Trading Signals for GOLD for August 25-29, 2025: sell below $3,378 (200 EMA - 5/8 Murray)

Once gold consolidates above $3,400 on the daily chart, it will be a good point to open long positions with a short-term target around the 8/8 Murray level at $3,500

Dimitrios Zappas 17:30 2025-08-25 UTC+2

Forecast for EUR/USD on August 25, 2025

On Friday, the EUR/USD pair rebounded from the 50.0% retracement level at 1.1590, reversed in favor of the European currency, and surged above the peaks of all previous waves

Samir Klishi 12:03 2025-08-25 UTC+2

Forecast for GBP/USD on August 25, 2025

On the hourly chart, GBP/USD on Friday reversed in favor of the British currency and showed a sharp rise, consolidating above the 76.4% Fibonacci level at 1.3482. Thus, the upward

Samir Klishi 11:45 2025-08-25 UTC+2

GBP/USD. Technical Analysis for the Week of August 25–30

Last week, the pair, moving upward, tested the 14.6% retracement level at 1.3527 (yellow dotted line), closing the weekly candle at 1.3525. In the upcoming week, the price may continue

Stefan Doll 11:09 2025-08-25 UTC+2

EUR/USD. Technical Analysis for the Week of August 25–30

Last week, the pair, moving downward, tested the 13-period EMA at 1.1580 (yellow thin line), and then the price moved upward, closing the weekly candle at 1.1720. In the upcoming

Stefan Doll 11:08 2025-08-25 UTC+2

GBP/USD. Indicator Analysis on August 25, 2025

On Friday, the pair moved upward to the 14.6% level at 1.3527 (yellow dotted line), closing the daily candle at 1.3525. Today it will attempt to start a downward movement

Stefan Doll 10:38 2025-08-25 UTC+2

EUR/USD. Indicator Analysis on August 25, 2025

On Friday, the pair moved upward, reaching the fractal at 1.1730 (blue dotted line), then reversed downward, closing the daily candle at 1.1720. Today it will attempt to begin

Stefan Doll 10:31 2025-08-25 UTC+2

Forex forecast 25/08/2025: EUR/USD, GBP/USD, USD/JPY, USDX, Gold, Ethereum and Bitcoin

Useful links: My other articles are available in this section InstaForex course for beginners Popular Analytics Open trading account Important: The begginers in forex trading need to be very careful

Sebastian Seliga 10:21 2025-08-25 UTC+2
Can't speak right now?
Ask your question in the chat.
 

Dear visitor,

Your IP address shows that you are currently located in the USA. If you are a resident of the United States, you are prohibited from using the services of InstaFintech Group including online trading, online transfers, deposit/withdrawal of funds, etc.

If you think you are seeing this message by mistake and your location is not the US, kindly proceed to the website. Otherwise, you must leave the website in order to comply with government restrictions.

Why does your IP address show your location as the USA?

  • - you are using a VPN provided by a hosting company based in the United States;
  • - your IP does not have proper WHOIS records;
  • - an error occurred in the WHOIS geolocation database.

Please confirm whether you are a US resident or not by clicking the relevant button below. If you choose the wrong option, being a US resident, you will not be able to open an account with InstaTrade anyway.

We are sorry for any inconvenience caused by this message.