See also

 24.02.2025 10:26 AM
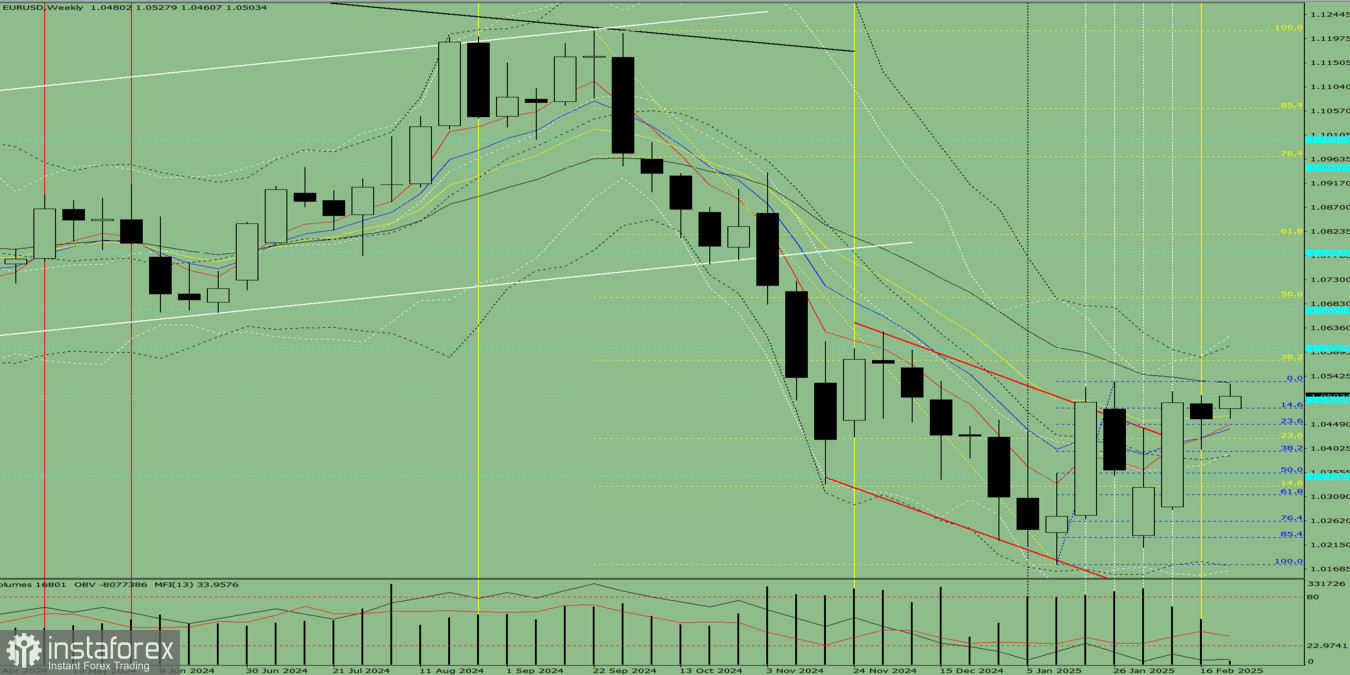
Comprehensive Analysis
Based on comprehensive analysis, the EUR/USD pair is expected to maintain an upward trajectory throughout the week. The projected weekly candle is likely to form without a lower shadow (indicating an upward Monday movement) but may develop an upper shadow by Friday, signaling a possible pullback.
Alternative Scenario
If the pair rises from 1.0459 to 1.0532 (upper fractal, blue dotted line), it may then reverse downward toward 1.0480, which corresponds to the 14.6% Fibonacci retracement level (blue dotted line).
You have already liked this post today
*The market analysis posted here is meant to increase your awareness, but not to give instructions to make a trade.


