empty
02.04.2025 11:17 AM
Forecast for GBP/USD on April 2, 2025

On the hourly chart, the GBP/USD pair continued to move sideways on Tuesday. There is currently no dominance of either bulls or bears in the market—and this has been the case for a full month. The 1.2931 level is not strong, so it's not advisable to look for trading opportunities around it. A rebound from the 1.2865 level would allow for some expectation of a pound recovery, while a breakout below this level would indicate the end of the sideways range and the beginning of a new bearish trend.

This image is no longer relevant

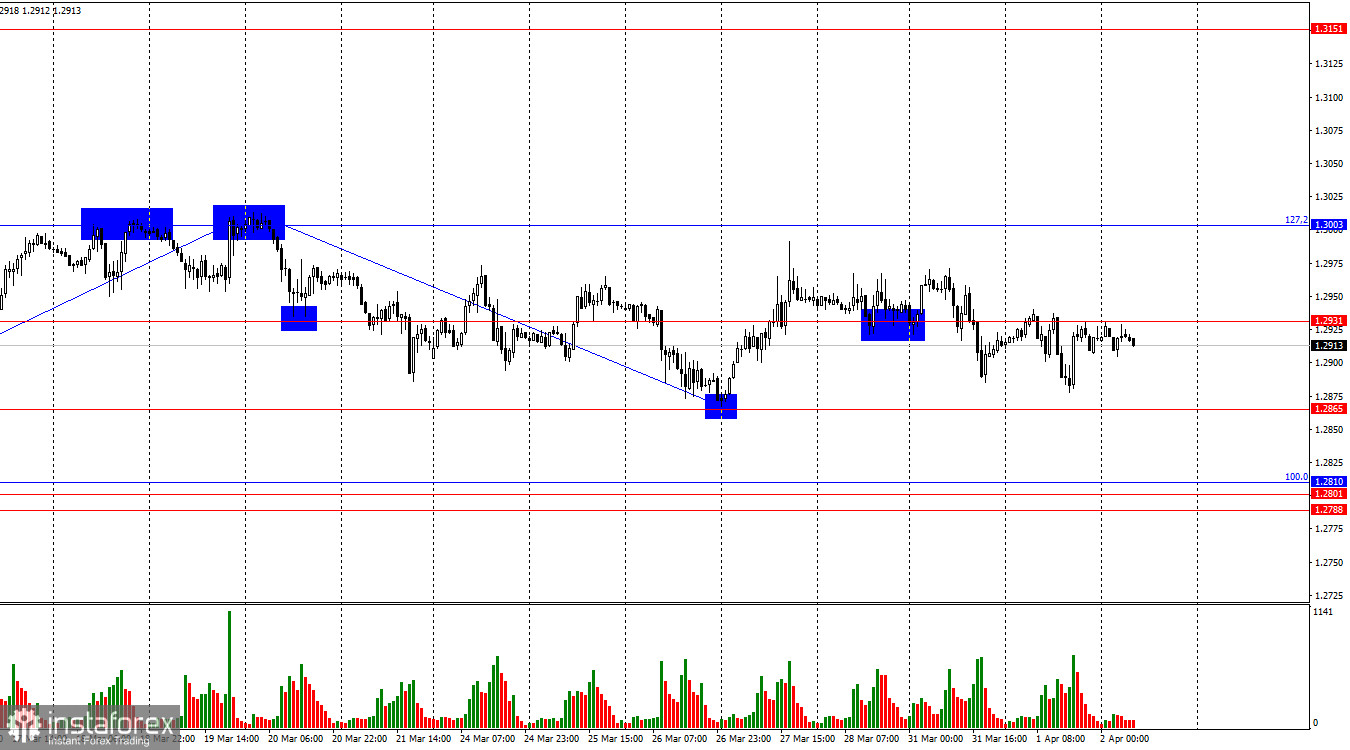
The last completed downward wave did not break the previous low, while the most recent upward wave did break the previous high. Thus, a bullish trend is still forming. Most traders remain reluctant to buy the U.S. dollar, regardless of economic data, as Donald Trump continues to impose new tariffs, which are expected to negatively impact U.S. and global economic growth in the future. For the bullish trend to shift into a bearish one, the pair would need to consolidate below 1.2865.

Tuesday's news background disappointed both bulls and bears. The UK Manufacturing PMI came in weak, ruling out hopes for significant GDP growth. The U.S. ISM Manufacturing PMI was also weak, and the JOLTS report came in even lower. Trump made no announcements regarding new import tariffs, and traders continue to wait. As a result, the only conclusion that can be drawn right now is that the pair remains in a sideways range. It's better for traders to wait for this phase to end, as the market is currently lacking momentum.

New tariffs from Trump could trigger a decline in the dollar, but I wouldn't be too certain about that scenario anymore. The market has had enough time to assess the total volume of tariffs and their potential economic consequences. Most likely, this has already been priced in. Therefore, the dollar could continue to recover—but only if bears start taking action, which so far, they haven't.

This image is no longer relevant

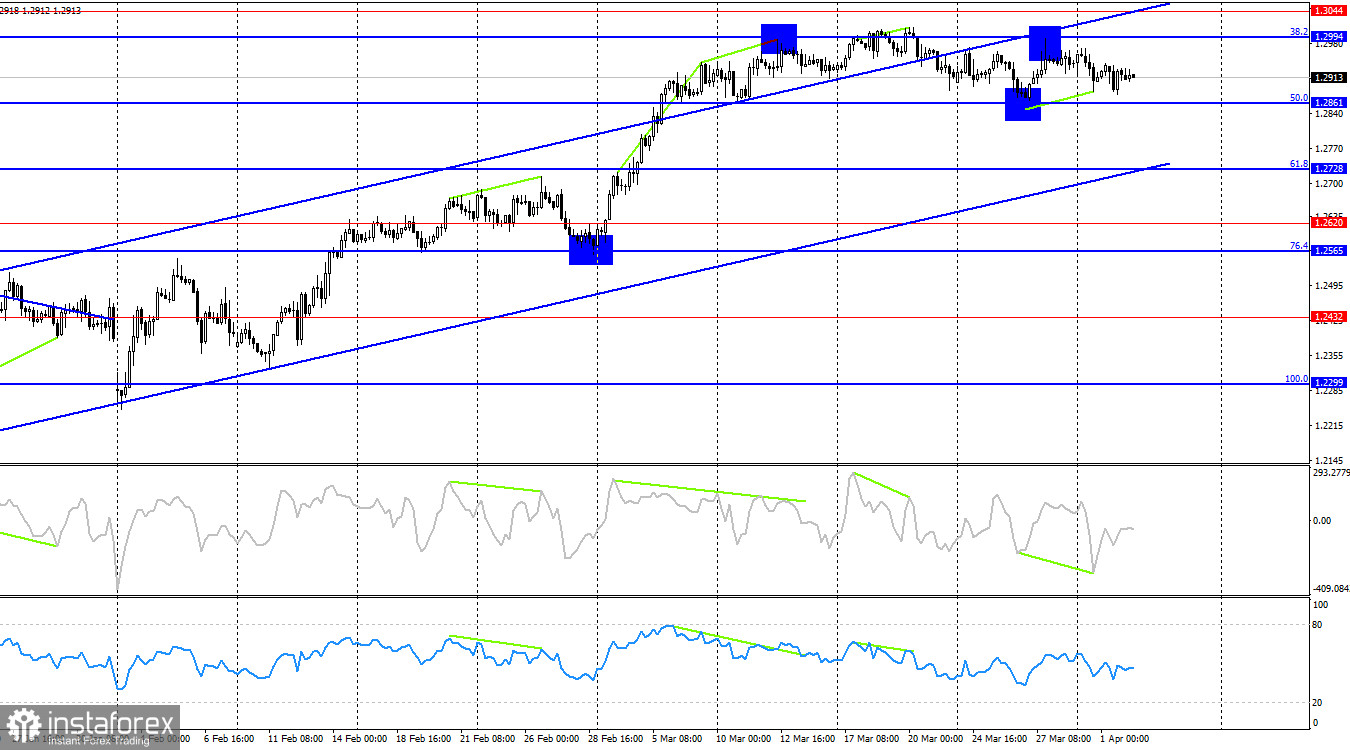
On the 4-hour chart, the pair is still in a bullish trend. I do not expect a significant decline in the pound until the pair breaks below the ascending channel. A rebound from the 38.2% Fibonacci level at 1.2994 once again worked in favor of the dollar, resulting in a slight decline toward the 50.0% retracement level at 1.2861. A bullish divergence in the CCI indicator supports the likelihood of a modest upward movement. Meanwhile, the hourly chart still shows a sideways market.

Commitments of Traders (COT) Report

This image is no longer relevant

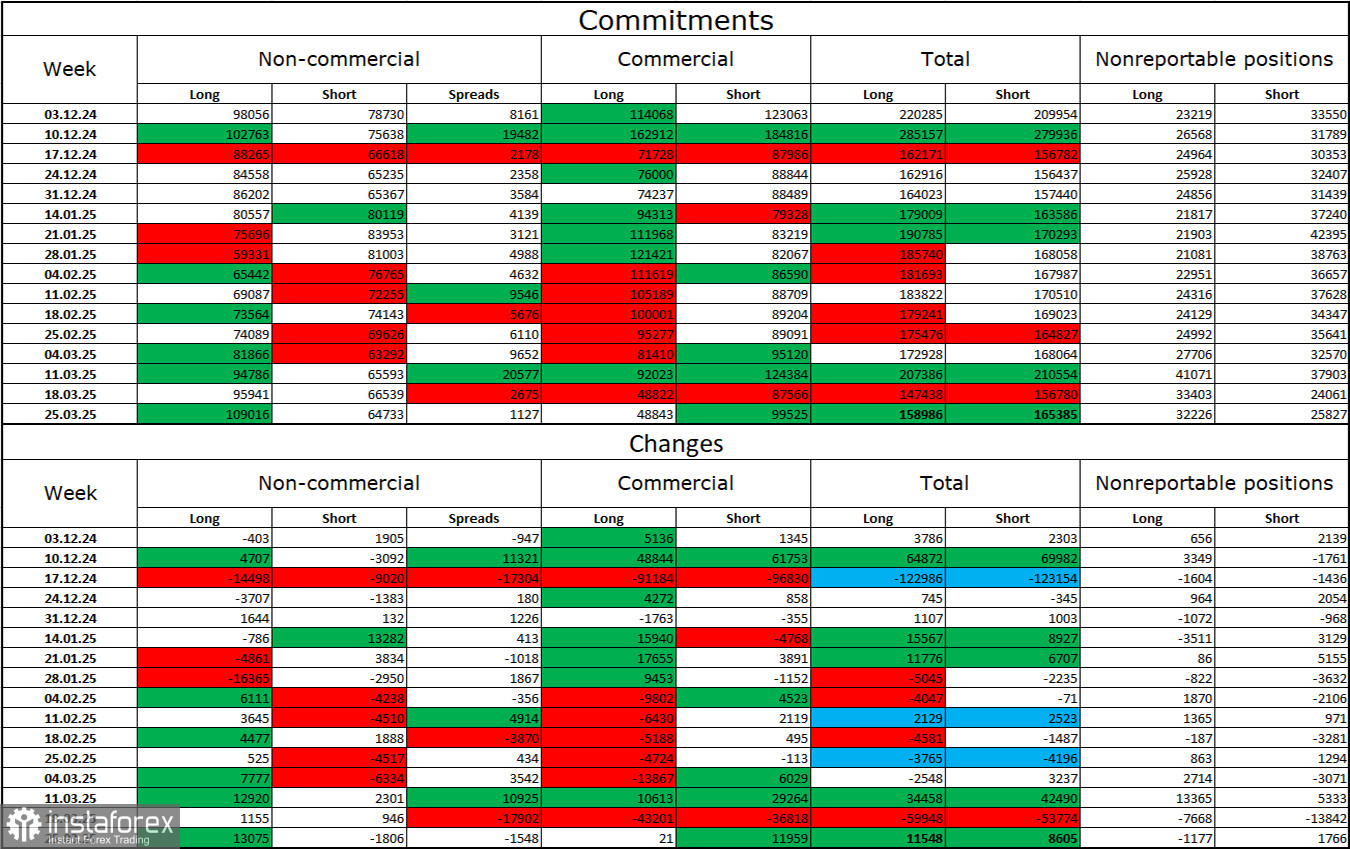
Sentiment in the "Non-commercial" trader category turned more bullish in the latest report. The number of long positions held by speculators increased by 13,075, while short positions decreased by 1,806. Bears have lost their advantage in the market. The gap between long and short positions now stands at nearly 44,000 in favor of the bulls: 109,000 vs. 65,000.

In my opinion, the pound still faces downside risk, but recent events could prompt a long-term market reversal. Over the past 3 months, long positions have grown from 98,000 to 109,000, while short positions have decreased from 78,000 to 65,000. More notably, in the past 8 weeks, longs have grown from 59,000 to 109,000, while shorts fell from 81,000 to 65,000. And let me remind you—that's "8 weeks of Trump's leadership"...

Economic Calendar for the U.S. and UK

  • U.S. – ADP Employment Change (12:15 UTC)

On Wednesday, the economic calendar contains only one entry, which is unlikely to help break the current range. The news background may have minimal influence on market sentiment today—unless Donald Trump breaks his silence.

GBP/USD Forecast and Trading Advice

Selling the pair will be possible after a rebound from the 1.3003 level on the hourly chart, with targets at 1.2931 and 1.2865, as the pair remains range-bound. Buying is possible after a rebound from the 1.2865 level, with targets at 1.2931 and 1.3003.

Fibonacci levels are plotted from 1.2809 to 1.2100 on the hourly chart, and from 1.2299 to 1.3432 on the 4-hour chart.

Samir Klishi,
Analytical expert of InstaTrade
© 2007-2025

Recommended Stories

Forecast for EUR/USD on August 20, 2025

On Tuesday, the EUR/USD pair first rebounded from the support level of 1.1637–1.1645, and then from the 76.4% retracement level – 1.1695. On Wednesday morning, the pair consolidated below

Samir Klishi 10:46 2025-08-20 UTC+2

Forecast for GBP/USD on August 20, 2025

On the hourly chart, the GBP/USD pair on Tuesday continued a weak decline and even consolidated below the 76.4% Fibonacci level – 1.3482. However, this morning bullish traders went

Samir Klishi 10:33 2025-08-20 UTC+2

Forex forecast 20/08/2025: EUR/USD, NZD/USD, GBP/USD, USD/JPY, Oil, Ethereum and Bitcoin

Useful links: My other articles are available in this section InstaForex course for beginners Popular Analytics Open trading account Important: The begginers in forex trading need to be very careful

Sebastian Seliga 10:06 2025-08-20 UTC+2

GBP/USD. Indicator Analysis on August 20, 2025

On Tuesday, the pair moved upward to the 14.6% level – 1.3527 (yellow dotted line), then went down and closed at 1.3487. Today, it may continue its downward movement

Stefan Doll 09:48 2025-08-20 UTC+2

EUR/USD. Indicator Analysis on August 20, 2025

On Tuesday, the pair moved upward to the 76.4% level – 1.1697 (yellow dotted line), then went down and closed at 1.1645. Today it may continue its downward movement

Stefan Doll 09:35 2025-08-20 UTC+2

#SPX. The Fed Minutes May Boost Demand for U.S. Equities

The CFD contract on the S&P 500 futures, after a notable decline on Tuesday, is already showing signs of a rebound on Wednesday amid still-strong expectations of a Federal Reserve

Pati Gani 09:31 2025-08-20 UTC+2

Crude oil appears set to continue its decline today. Wednesday, August 20, 2025.

[Crude Oil] – [Wednesday, August 20, 2025] Crude oil has the potential to continue its decline today, where it is supported by the 50-day moving average (EMA) below the 200-day

Arief Makmur 08:01 2025-08-20 UTC+2

Although the AUD/USD bias remains bearish, there is potential for strengthening today. Wednesday, August 20, 2025.

[AUD/USD] – [Wednesday, August 20, 2025] Although the 50-day moving average (EMA) and 200-day moving average (EMA) are still forming a Death Cross, the appearance of a divergence between

Arief Makmur 08:01 2025-08-20 UTC+2

Trading Signals for EUR/USD for August 20-23, 2025: buy above 1.1650 (200 EMA - 7/8 Murray)

The Euro is trading within the uptrend channel formed since early August, but is showing signs of exhaustion. In case a technical rebound occurs above 1.1658, we could expect EUR/USD

Dimitrios Zappas 06:37 2025-08-20 UTC+2

Trading Signals for BITCOIN for August 20-23, 2025: buy above $12,500 (4/8 Murray - rebound)

The 4/8 Murray level seen on the H4 chart represents strong support for Bitcoin. In early August, this support gave BTC a strong bullish push, so we believe that

Dimitrios Zappas 06:35 2025-08-20 UTC+2
Can't speak right now?
Ask your question in the chat.
 

Dear visitor,

Your IP address shows that you are currently located in the USA. If you are a resident of the United States, you are prohibited from using the services of InstaFintech Group including online trading, online transfers, deposit/withdrawal of funds, etc.

If you think you are seeing this message by mistake and your location is not the US, kindly proceed to the website. Otherwise, you must leave the website in order to comply with government restrictions.

Why does your IP address show your location as the USA?

  • - you are using a VPN provided by a hosting company based in the United States;
  • - your IP does not have proper WHOIS records;
  • - an error occurred in the WHOIS geolocation database.

Please confirm whether you are a US resident or not by clicking the relevant button below. If you choose the wrong option, being a US resident, you will not be able to open an account with InstaTrade anyway.

We are sorry for any inconvenience caused by this message.