empty
03.04.2025 11:25 AM
EUR/USD – April 3rd: The Dollar Suffers Another Collapse

On Wednesday, the EUR/USD pair surged sharply. This movement can hardly be called a mere rise. When it comes to the U.S. dollar, it was another collapse—one of many seen in 2025, more frequent than before Donald Trump came to power. As of yesterday and this morning, the pair firmly broke above the 1.0944 level, opening the way for the euro to reach the 261.8% Fibonacci retracement level at 1.1057. For now, considering a decline in EUR/USD seems unreasonable.

This image is no longer relevant

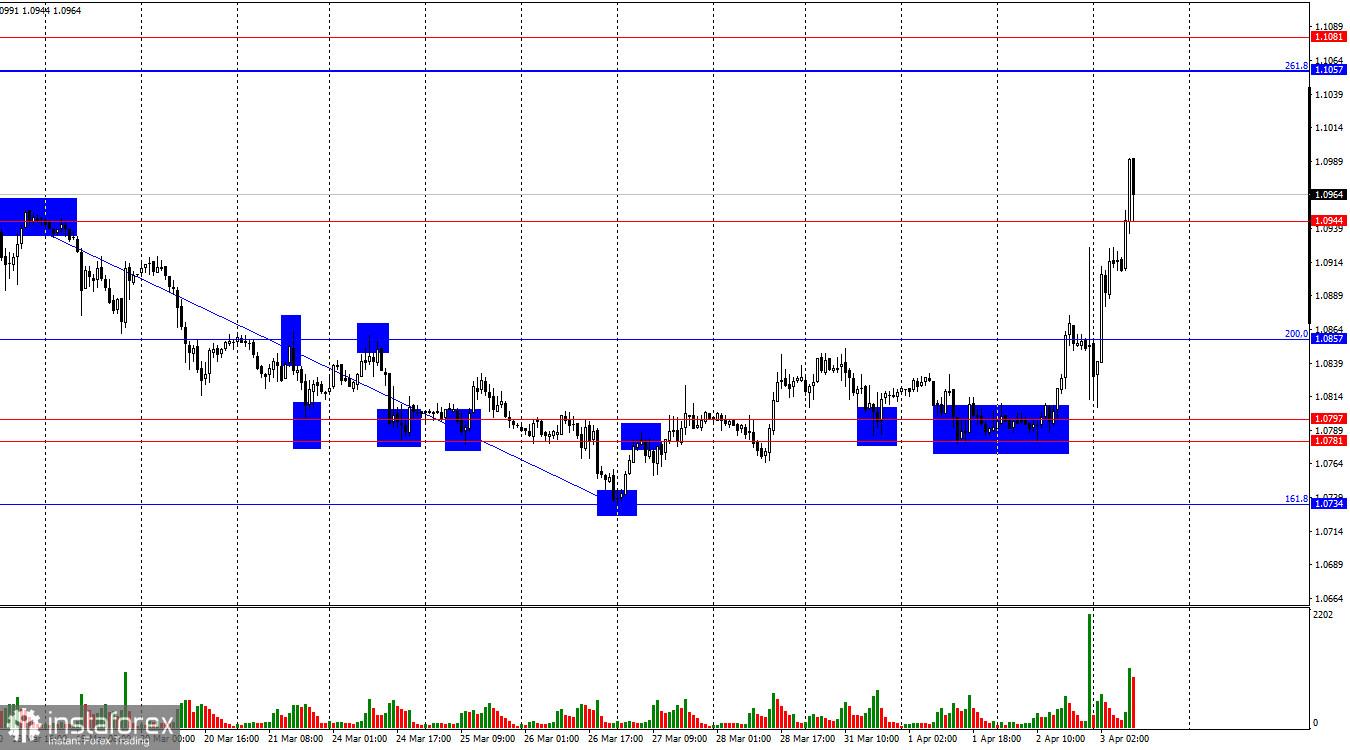
The wave pattern on the hourly chart has shifted. The last completed downward wave broke below the previous low, but the most recent upward wave has exceeded the previous high. This currently indicates a reversal in trend to a bullish direction.

Donald Trump imposed new tariffs last week and followed up this week with global tariffs on all categories of goods. Bulls had shown weakness recently, but as it turned out yesterday, it wasn't weakness—it was simply anticipation.

The fundamental backdrop on Wednesday is hardly worth analyzing. The U.S. ADP labor market report was released but largely ignored by traders. The dollar began falling as soon as the U.S. session opened. Clearly, the market was bracing for the worst even before Trump's speech at the White House. As it turned out, they were right.

President Trump imposed new tariffs—not selectively this time, but on all American imports. And that's not all. Several countries were hit with individual tariff rates, some as high as 70–90%. All previous trade actions by Trump now seem mild by comparison. Now, every country in the world will, in one way or another, pay to access the U.S. market—or abandon it altogether—or be forced to slash exports. As before, the dollar plunged on such news, regardless of any technical indicators.

This image is no longer relevant

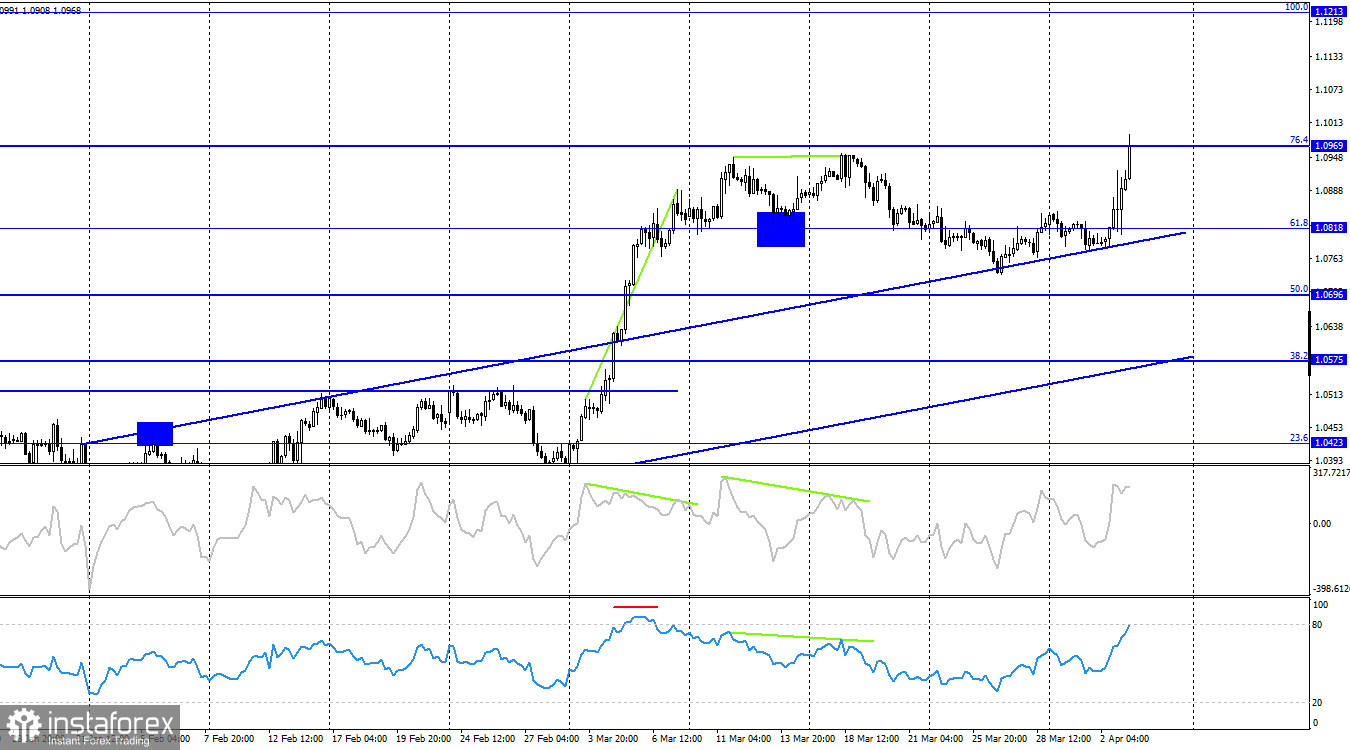
On the 4-hour chart, the pair has made a new bullish reversal and is rising toward the 76.4% Fibonacci level at 1.0969. The euro's growth, unsupported by EU data, should have ended long ago—but Trump's actions continue to weigh heavily on the dollar. A rebound from the 1.0969 level may prompt a slight pullback, but who's thinking about a decline now? A close above 1.0969 will likely lead to continued growth toward the next Fibonacci level at 1.1213.

Commitments of Traders (COT) Report

This image is no longer relevant

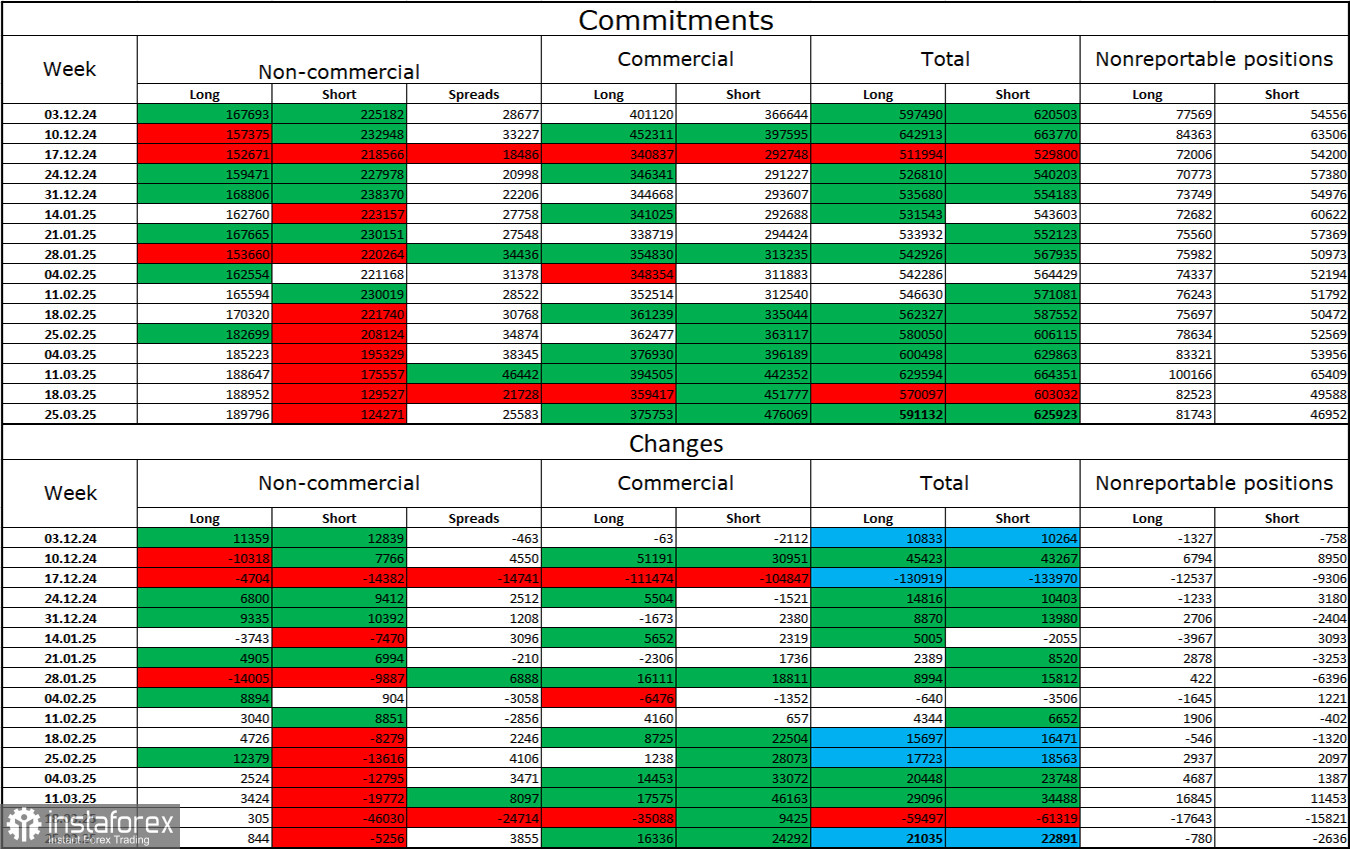
During the latest reporting week, professional traders opened 844 new long positions and closed 5,256 short ones. The "non-commercial" group sentiment became bullish again—thanks to Donald Trump. The total number of long positions held by speculators now stands at 190,000, while short positions are down to 124,000.

For 20 consecutive weeks, large traders had been selling off the euro. But for the past 7 weeks, they've been closing shorts and adding longs. The ECB–Fed policy divergence still favors the dollar, but Trump's policies are now a more significant factor for traders, as they could push the FOMC into a dovish stance and potentially trigger a U.S. recession.

Economic Calendar – April 3 (U.S. and EU):

  • U.S. – Nonfarm Payrolls Change (12:30 UTC)
  • U.S. – Unemployment Rate (12:30 UTC)
  • U.S. – Average Hourly Earnings (12:30 UTC)
  • U.S. – Fed Chair Jerome Powell Speaks (15:25 UTC)

While the April 3 calendar includes three very important events, it's unclear whether the market will even care about them. Market sentiment on Friday will likely be driven more by Trump's actions than by strong U.S. data.

EUR/USD Forecast and Trader Tips:

In the current environment, I would not consider selling the pair. Buying was possible yesterday on a rebound from the 1.0781–1.0797 zone (H1 chart) with a target of 1.0857. The next target at 1.0944 was also reached and broken, so long positions can be held with a new target at 1.1057.

Fibonacci levels were drawn between 1.0529 and 1.0213 on the hourly chart, and between 1.1214 and 1.0179 on the 4-hour chart.

Samir Klishi,
Analytical expert of InstaTrade
© 2007-2025

Recommended Stories

XAU/USD. Analysis and Forecast

Gold prices are declining for the second consecutive day from record highs after volatility triggered by the Fed's actions. For the second day in a row, gold prices are retreating

Irina Yanina 20:12 2025-09-18 UTC+2

Forecast for EUR/USD on September 18, 2025

On Wednesday, the EUR/USD pair rebounded from the 127.2% corrective level at 1.1896, reversed in favor of the U.S. dollar, and fell into the support zone of 1.1789–1.1802

Samir Klishi 12:21 2025-09-18 UTC+2

Forecast for GBP/USD on September 18, 2025

On the hourly chart, the GBP/USD pair on Wednesday rose to the 127.2% Fibonacci level at 1.3708, rebounded from it, and reversed in favor of the U.S. dollar, falling into

Samir Klishi 12:17 2025-09-18 UTC+2

GBP/USD. Indicator analysis on September 18, 2025

On Wednesday, the pair moved upward to resistance at 1.3725 (blue dotted line), then turned downward, closing the daily candle at 1.3622. Today, it may continue moving lower. On Thursday

Stefan Doll 11:59 2025-09-18 UTC+2

EUR/USD. Indicator analysis on September 18, 2025

On Wednesday, the pair moved upward to the 208% level at 1.1908 (red dotted line), then turned downward, closing the daily candle at 1.1812. Today, it may continue moving lower

Stefan Doll 11:38 2025-09-18 UTC+2

Forex forecast 18/09/2025: EUR/USD, GBP/USD, USD/JPY, USDX and Bitcoin

Useful links: My other articles are available in this section InstaForex course for beginners Popular Analytics Open trading account Important: The begginers in forex trading need to be very careful

Sebastian Seliga 10:14 2025-09-18 UTC+2

There is potential for XPD/USD to weaken today with the appearance of a Hidden Bearish Divergence. Thursday, September 18, 2025.

[XPD/USD] – [Thursday, September 18, 2025] The appearance of a Hidden Bearish Divergence, coupled with the two EMAs crossing with a Death Cross, indicates that Palladium has the potential

Arief Makmur 07:28 2025-09-18 UTC+2

The Nasdaq 100 Index has the potential to strengthen today, reaching its nearest resistance level. Thursday, September 18, 2025.

[Nasdaq 100 Index] – [Thursday, September 18, 2025] The Nasdaq 100 Index has the potential to strengthen today, as confirmed by its two EMAs intersecting in a Golden Cross

Arief Makmur 07:28 2025-09-18 UTC+2

Trading Signals for EUR/USD for September 18-23, 2025: buy above $1.1790 (+1/8 Murray - 21 SMA)

Early in the European session, the euro is trading around 1.1813 following a technical correction after the price reached a new high around 1.1917. The euro has been trading within

Dimitrios Zappas 06:50 2025-09-18 UTC+2

Trading Signals for GOLD (XAU/USD) for September 18-23, 2025: sell bellow $3,671 (7/8 Murray - 21 SMA)

Conversely, if gold consolidates above $3,671, it could continue its rise until it reaches the 61.8% Fibonacci level around $3,685. The price could even reach the psychological level of $3,700

Dimitrios Zappas 06:48 2025-09-18 UTC+2
Can't speak right now?
Ask your question in the chat.
 

Dear visitor,

Your IP address shows that you are currently located in the USA. If you are a resident of the United States, you are prohibited from using the services of InstaFintech Group including online trading, online transfers, deposit/withdrawal of funds, etc.

If you think you are seeing this message by mistake and your location is not the US, kindly proceed to the website. Otherwise, you must leave the website in order to comply with government restrictions.

Why does your IP address show your location as the USA?

  • - you are using a VPN provided by a hosting company based in the United States;
  • - your IP does not have proper WHOIS records;
  • - an error occurred in the WHOIS geolocation database.

Please confirm whether you are a US resident or not by clicking the relevant button below. If you choose the wrong option, being a US resident, you will not be able to open an account with InstaTrade anyway.

We are sorry for any inconvenience caused by this message.