empty
10.04.2025 05:08 AM
S&P 500 Forecast for April 10, 2025

The U.S. stock index, the S&P 500, posted one of the largest single-day gains in its history yesterday. It fell just a few points short of the target level at 5516.00. There's also the subtle question of whether the April 2–3 gap has been fully closed. If the market senses something is incomplete, it may linger for another day or two within the gray rectangle marked on the daily chart. A critical resistance level is the MACD line around 5669.50. A breakout above it could resume the medium-term uptrend, potentially pushing the index to new all-time highs.

This image is no longer relevant

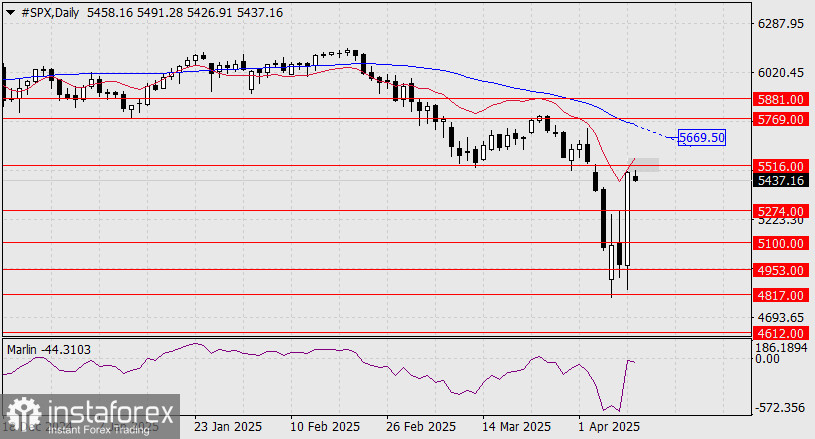
However, our main scenario anticipates a reversal, with the price pulling back to support at 4612.00—the July 2023 peak. The Marlin oscillator also turns down from the zero line, supporting this outlook. The reasoning is that among the 75 countries Trump announced tariff reductions for (down to the base 10%) yesterday, none are the U.S.'s primary trading partners.

This image is no longer relevant

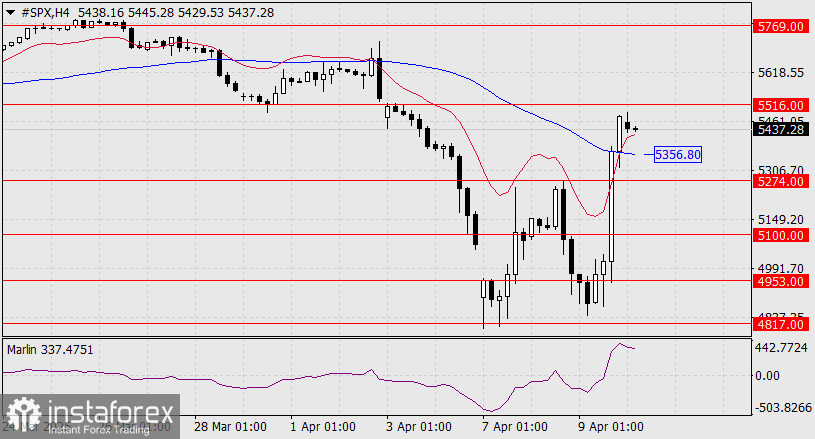
On the 4-hour timeframe, the price remains above the MACD line, which allows for a more precise test of 5516.00, perhaps even overshooting it. However, a break below the MACD line and 5356.00 could open the way to 5274.00, and a close below that would confirm the reversal scenario.

Laurie Bailey,
Analytical expert of InstaTrade
© 2007-2025

Recommended Stories

Forecast for EUR/USD on September 23, 2025

EUR/USD The weakness the euro showed at the Kijun-sen (MACD) line (daily) quickly resulted in a sharp rebound back into the range of September 18, as rising yields on U.S

Laurie Bailey 05:58 2025-09-23 UTC+2

Forecast for GBP/USD on September 23, 2025

GBP/USD Yesterday's 0.39% drop in the U.S. dollar index hindered the continuation of the British pound's downward movement. The price returned to the Kijun-sen (MACD) line, and during today's Pacific

Laurie Bailey 05:51 2025-09-23 UTC+2

Forecast for USD/CAD on September 23, 2025

USD/CAD Yesterday was a significant day for the USD/CAD pair — the price broke through the resistance of the balance indicator line and the target level of 1.3810, accompanied

Laurie Bailey 05:44 2025-09-23 UTC+2

USD/JPY. Analysis and Forecast

Technically speaking, the price holding above the round-number level of 148.00 paves the way for continued growth in the USD/JPY currency pair. Additionally, daily chart oscillators remain in positive territory

Irina Yanina 21:45 2025-09-22 UTC+2

Forecast for EUR/USD on September 22, 2025

On Friday, the EUR/USD pair continued its decline after bouncing off the 1.1789–1.1802 zone. The decline in the euro may continue toward the 76.4% corrective level at 1.1695

Samir Klishi 11:45 2025-09-22 UTC+2

Forecast for GBP/USD on September 22, 2025

On the hourly chart, the GBP/USD pair continued its decline on Friday after consolidating below the 1.3587–1.3620 zone and ended the day with a close below the 76.4% Fibonacci level

Samir Klishi 11:36 2025-09-22 UTC+2

GBP/USD. Technical Analysis for the Week of September 22–27

Last week, the pair moved upward toward the Bollinger Band line at 1.3721 (black dashed line), and then the price turned downward, closing the weekly candle at 1.3466

Stefan Doll 11:24 2025-09-22 UTC+2

EUR/USD. Technical Analysis for the Week of September 22–27

Last week, the pair moved upward and tested the 161.8% target level at 1.1886 (red dashed line), after which the price moved down, closing the weekly candle at 1.1745

Stefan Doll 11:21 2025-09-22 UTC+2

GBP/USD Indicator Analysis on September 22, 2025

On Friday, the pair moved downward, breaking through the 61.8% retracement level at 1.3465 (blue dashed line), and closed the daily candle at 1.3462. Today, the price will attempt

Stefan Doll 11:14 2025-09-22 UTC+2

EUR/USD. Indicator Analysis on September 22, 2025

On Friday, the pair moved downward. The 13-period EMA – 1.1698 (yellow thin line) turned upward, closing the daily candle at 1.1745. Today, the pair will attempt to begin upward

Stefan Doll 11:10 2025-09-22 UTC+2
Can't speak right now?
Ask your question in the chat.
 

Dear visitor,

Your IP address shows that you are currently located in the USA. If you are a resident of the United States, you are prohibited from using the services of InstaFintech Group including online trading, online transfers, deposit/withdrawal of funds, etc.

If you think you are seeing this message by mistake and your location is not the US, kindly proceed to the website. Otherwise, you must leave the website in order to comply with government restrictions.

Why does your IP address show your location as the USA?

  • - you are using a VPN provided by a hosting company based in the United States;
  • - your IP does not have proper WHOIS records;
  • - an error occurred in the WHOIS geolocation database.

Please confirm whether you are a US resident or not by clicking the relevant button below. If you choose the wrong option, being a US resident, you will not be able to open an account with InstaTrade anyway.

We are sorry for any inconvenience caused by this message.