See also
USD/JPY
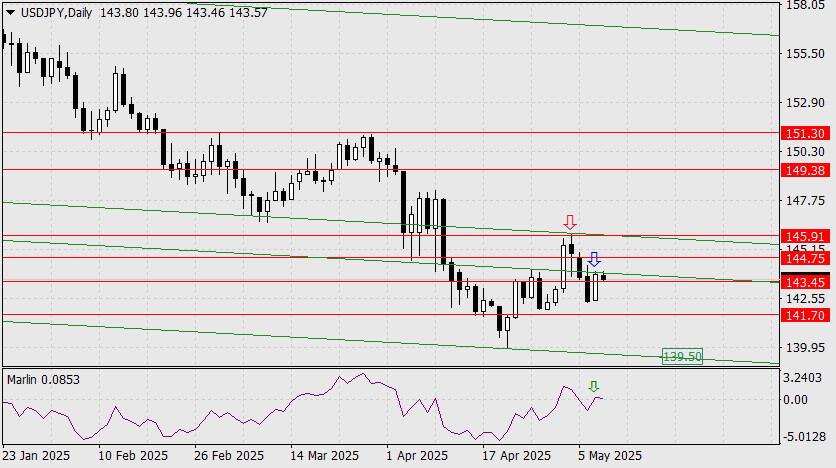
The daily chart shows that the price is reversing downward from the green price channel lines. The first such reversal occurred on May 2, marked by a red arrow, while the second reversal is taking place today at the opening of the trading session (indicated by a blue arrow).
Moreover, today's reversal is synchronized with a downward reversal of the Marlin oscillator from the zero line. If today's daily candle closes below the 143.45 level, it will open the path toward the nearest target at 141.70, and potentially to the lower boundary of the price channel near the 139.50 mark.
Conversely, a close above yesterday's high at 144.00 would activate an alternative bullish scenario, with potential growth toward 144.75 and a longer-term target at 145.91 — a magnet point formed at the intersection of the channel line with the horizontal level.
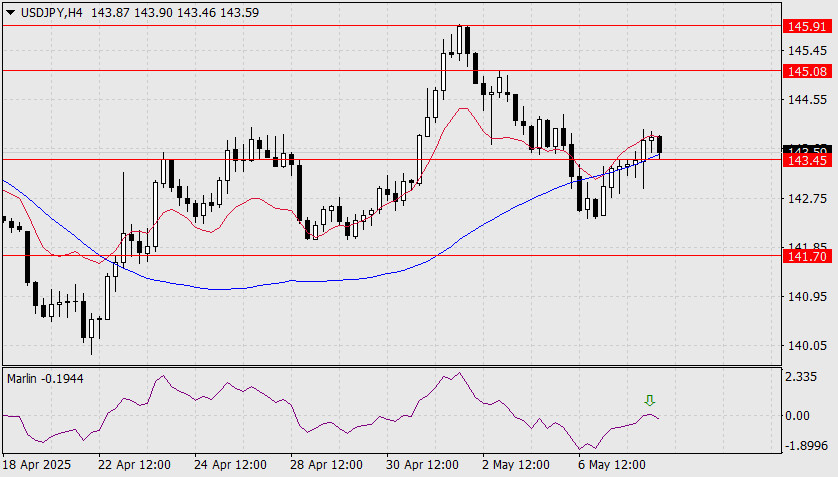
On the four-hour chart, the Marlin oscillator's reversal from the zero line aligns perfectly with the same reversal seen on the daily timeframe. This creates a strong reversal pattern. The price is currently testing support at the MACD line and the key level at 143.45. A firm break below this level would confirm the start of the main bearish scenario for the USD/JPY pair.
You have already liked this post today
*The market analysis posted here is meant to increase your awareness, but not to give instructions to make a trade.
Useful links: My other articles are available in this section InstaForex course for beginners Popular Analytics Open trading account Important: The begginers in forex trading need to be very careful
[XPD/USD] – [Thursday, September 18, 2025] The appearance of a Hidden Bearish Divergence, coupled with the two EMAs crossing with a Death Cross, indicates that Palladium has the potential
[Nasdaq 100 Index] – [Thursday, September 18, 2025] The Nasdaq 100 Index has the potential to strengthen today, as confirmed by its two EMAs intersecting in a Golden Cross
Early in the European session, the euro is trading around 1.1813 following a technical correction after the price reached a new high around 1.1917. The euro has been trading within
Conversely, if gold consolidates above $3,671, it could continue its rise until it reaches the 61.8% Fibonacci level around $3,685. The price could even reach the psychological level of $3,700
InstaTrade video
analytics
Daily analytical reviews
InstaTrade
video analytics
Your IP address shows that you are currently located in the USA. If you are a resident of the United States, you are prohibited from using the services of InstaFintech Group including online trading, online transfers, deposit/withdrawal of funds, etc.
If you think you are seeing this message by mistake and your location is not the US, kindly proceed to the website. Otherwise, you must leave the website in order to comply with government restrictions.
Why does your IP address show your location as the USA?
Please confirm whether you are a US resident or not by clicking the relevant button below. If you choose the wrong option, being a US resident, you will not be able to open an account with InstaTrade anyway.
We are sorry for any inconvenience caused by this message.