empty
16.05.2025 10:21 AM
EUR/USD. May 16th. A Challenging Path for the Dollar
On Thursday, the EUR/USD pair twice declined toward the 127.2% Fibonacci level at 1.1181 and bounced off it both times, signaling a reversal in favor of the euro. This opens the door for continued growth today toward the resistance zone at 1.1265–1.1282. A firm close below 1.1181 would favor the U.S. dollar and a renewed decline toward the support zone at 1.1074–1.1081. Bears are still holding the market, but the pressure is mounting.

This image is no longer relevant

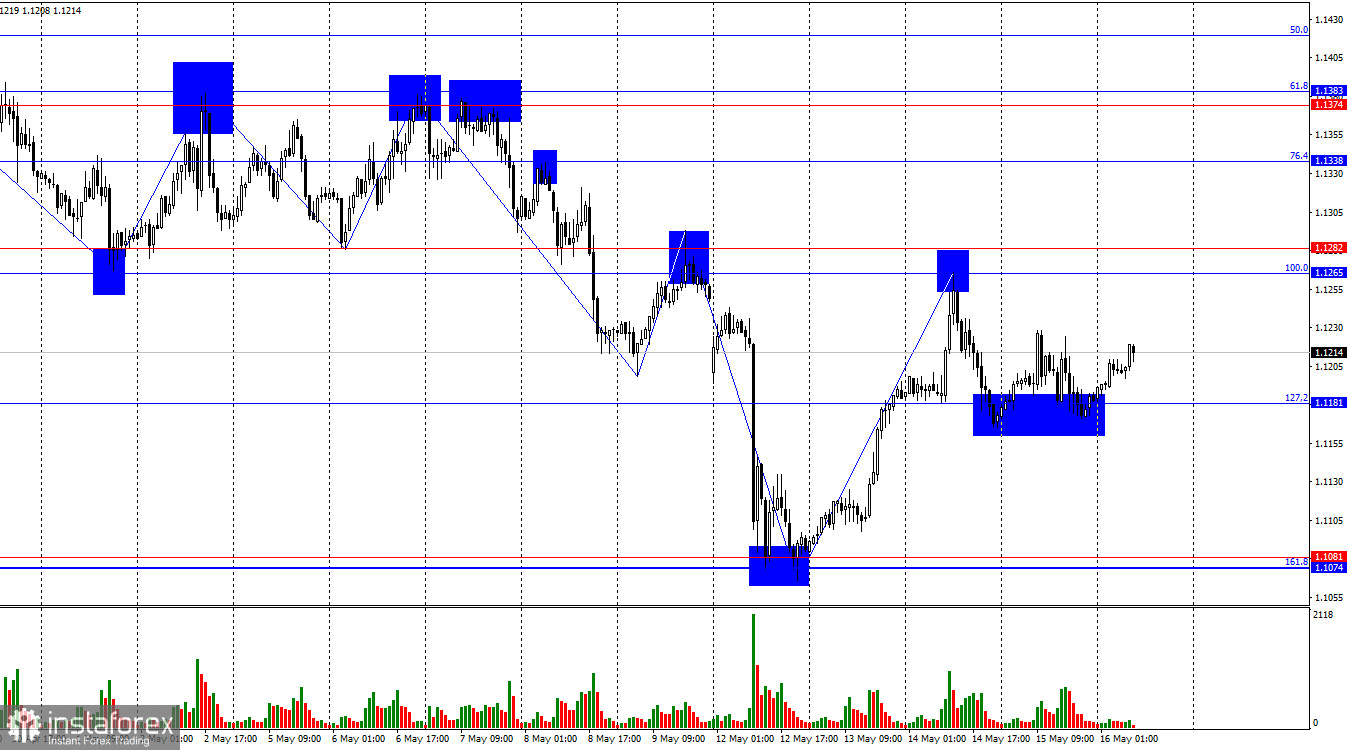
On the hourly chart, the wave structure remains straightforward. The last completed upward wave failed to break the previous high, while the most recent downward wave broke the previous low—thus maintaining the bearish trend. News of progress in U.S.-China trade talks supported the bears, but they still have many hurdles to overcome before claiming victory.

Thursday's fundamental backdrop offered little help to either bulls or bears. Reports from both the Eurozone and the U.S. were strikingly mixed. Eurozone industrial production jumped by a record 2.6% in March, but GDP growth slowed from 0.4% q/q to 0.3% in Q1. In the U.S., retail sales rose by 0.1% m/m in April—beating expectations—but the Producer Price Index unexpectedly declined by 0.5%. Rather than the inflation acceleration promised by Jerome Powell, the data suggest further disinflation may be ahead.

At some point, even Powell may be forced to concede, and the Fed might reduce rates—despite the FOMC president's firm stance last meeting that no such action was necessary. Throughout Thursday, the market moved sideways in response to the contradictory data, while traders continued waiting for new trade deals from the Trump administration. As of now, only one deal has been signed—with the UK—which is not enough to justify a confident or sustained bearish run.

This image is no longer relevant

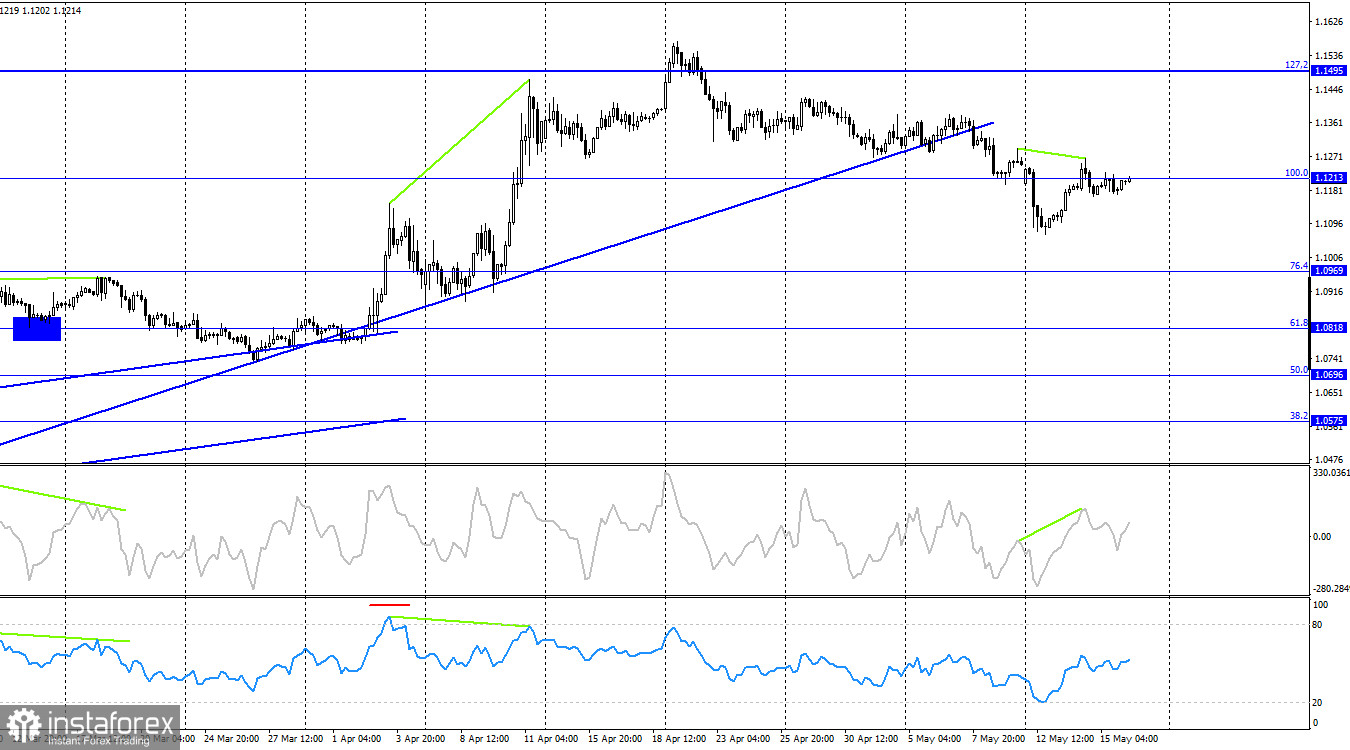
On the 4-hour chart, the pair remains below the 100.0% Fibonacci level at 1.1213, keeping the door open for a further decline toward the next retracement at 76.4% — 1.0969. A rebound from 1.1213 could revive support for the dollar, while a close above it would favor the euro and the return of a bullish trend toward the 127.2% Fibonacci level at 1.1495. A bearish divergence in the CCI indicator increases the likelihood of renewed price declines.

Commitments of Traders (COT) Report:

This image is no longer relevant

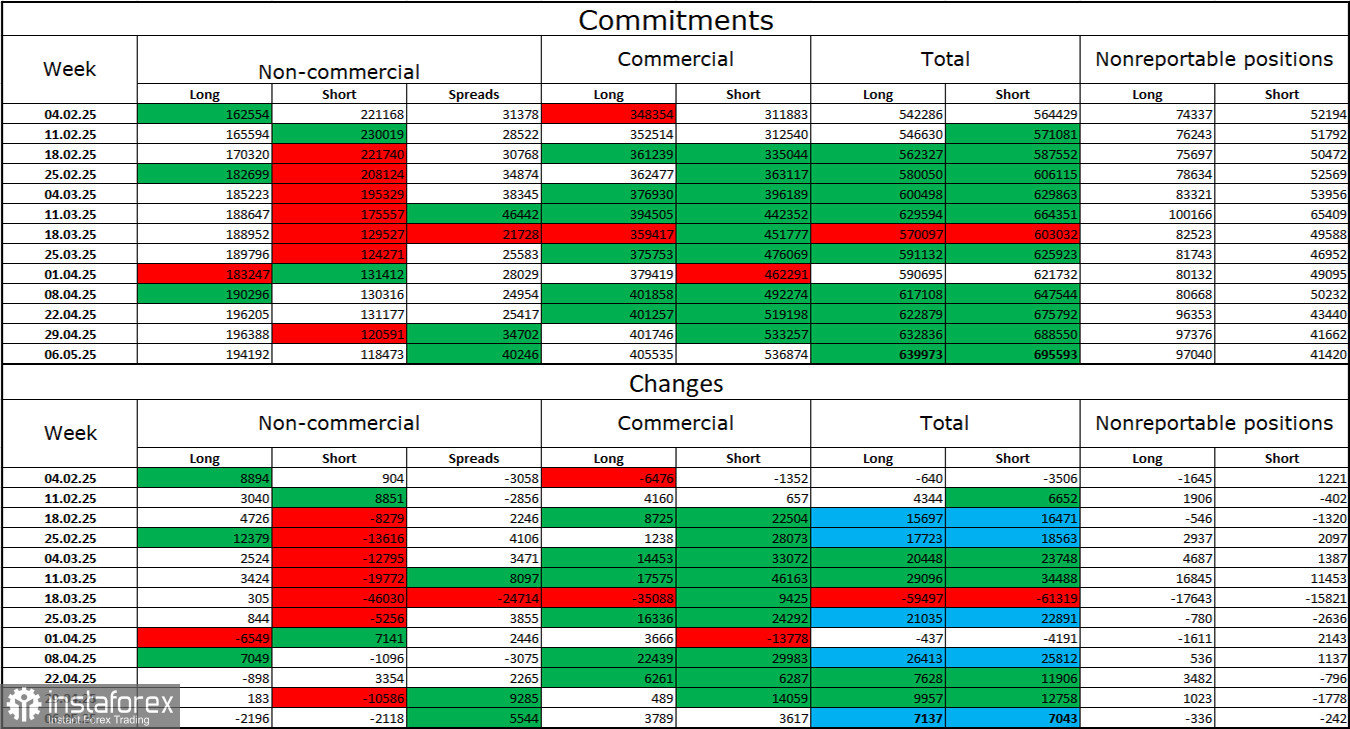
Over the latest reporting week, professional traders closed 2,196 long positions and 2,118 short positions. The sentiment among non-commercial traders remains bullish—thanks in part to Donald Trump. The total number of long positions held by speculators now stands at 194,000, compared to 118,000 short positions. Just a few months ago, the situation was reversed.

Large investors had been shedding euro positions for 20 weeks, but they've now been increasing long positions and reducing shorts for 13 consecutive weeks. While the policy divergence between the ECB and the Fed continues to favor the U.S. dollar, Trump's political influence remains a major wildcard, as his actions could trigger a recession in the U.S.

Economic Calendar – May 16:

U.S.:

  • Building Permits (12:30 UTC)
  • Housing Starts (12:30 UTC)
  • University of Michigan Consumer Sentiment Index (14:00 UTC)

Friday's economic calendar contains several entries, but none are considered major. Overall, the fundamental backdrop is expected to exert limited influence on market sentiment.

EUR/USD Forecast and Trading Advice:

Selling the pair is advisable today upon a close below 1.1181 on the hourly chart, with a target at the 1.1074–1.1081 zone. Alternatively, another rebound from the 1.1213 level on the H4 could also trigger a sell opportunity. As of now, I do not see any clear patterns that would support buying.

Fibonacci Grids:

  • Hourly: built from 1.1265 to 1.1574
  • 4-hour: built from 1.1214 to 1.0179
Samir Klishi,
Analytical expert of InstaTrade
© 2007-2025

Recommended Stories

USD/JPY. Analysis and Forecast

From a technical perspective, spot prices remain within the weekly trading range. However, it is too early to confirm a full bearish consolidation, as oscillators on the daily chart remain

Irina Yanina 13:58 2025-08-08 UTC+2

Forecast for EUR/USD on August 8, 2025

On Thursday, the EUR/USD pair rebounded from the 76.4% retracement level at 1.1695, reversed in favor of the U.S. dollar, and fell below the support zone of 1.1637–1.1645. Today

Samir Klishi 11:10 2025-08-08 UTC+2

GBP/USD. August 8th. The Bank of England's decision leaves the pound largely unaffected

On the hourly chart, the GBP/USD pair continued to rise on Thursday, consolidating above the resistance zone of 1.3357–1.3371 and the level of 1.3425. Thus, on Friday, the upward movement

Samir Klishi 11:02 2025-08-08 UTC+2

GBP/USD. Indicator analysis on August 8, 2025

Trend analysis (Fig. 1). On Friday, from the level of 1.3440 (yesterday's daily candle close), the market may start moving downward toward 1.3378 — the 23.6% retracement level (yellow dashed

Stefan Doll 10:57 2025-08-08 UTC+2

EUR/USD. Indicator analysis on August 8, 2025

On Thursday, the pair, moving upward, tested the 76.4% retracement level at 1.1698 (blue dashed line) and then moved down, closing the daily candle at 1.1664. Today, the pair

Stefan Doll 10:25 2025-08-08 UTC+2

Forex forecast 08/08/2025: EUR/USD, USD/JPY, GBP/USD, SP500, Ethereum and Bitcoin

Useful links: My other articles are available in this section InstaForex course for beginners Popular Analytics Open trading account Important: The begginers in forex trading need to be very careful

Sebastian Seliga 09:47 2025-08-08 UTC+2

EUR/USD Forecast for August 8, 2025

It appears that the 1.1392–1.1632 range (or slightly higher) is quite comfortable for the euro, with substantial retail buy orders starting to accumulate within it. But therein lies the well-known

Laurie Bailey 04:52 2025-08-08 UTC+2

GBP/USD Forecast for August 8, 2025

Following yesterday's Bank of England decision to cut the rate with a minimal majority (5 to 4), the British pound consolidated above the 1.3364 level, opening the path toward

Laurie Bailey 04:52 2025-08-08 UTC+2

USD/CAD Forecast for August 8, 2025

Yesterday, the Canadian dollar completed a 50% correction of the upward movement from July 23 to August 1. The signal line of the Marlin oscillator began to slow down near

Laurie Bailey 04:44 2025-08-08 UTC+2

Trading Signals for GOLD (XAU/USD) for August 7-9, 2025: sell below $3,400 or $3,373 (21 SMA - 7/8 Murray)

If gold sharply breaks the uptrend channel and consolidates below the 21 SMA, this could be seen as an opportunity to sell, with targets at 3,343, 3,320, and finally

Dimitrios Zappas 17:35 2025-08-07 UTC+2
Can't speak right now?
Ask your question in the chat.
 

Dear visitor,

Your IP address shows that you are currently located in the USA. If you are a resident of the United States, you are prohibited from using the services of InstaFintech Group including online trading, online transfers, deposit/withdrawal of funds, etc.

If you think you are seeing this message by mistake and your location is not the US, kindly proceed to the website. Otherwise, you must leave the website in order to comply with government restrictions.

Why does your IP address show your location as the USA?

  • - you are using a VPN provided by a hosting company based in the United States;
  • - your IP does not have proper WHOIS records;
  • - an error occurred in the WHOIS geolocation database.

Please confirm whether you are a US resident or not by clicking the relevant button below. If you choose the wrong option, being a US resident, you will not be able to open an account with InstaTrade anyway.

We are sorry for any inconvenience caused by this message.