empty
19.05.2025 11:40 AM
Weekly Forecast Using Simplified Wave Analysis for EUR/USD, USD/JPY, GBP/JPY, USD/CAD, NZD/USD, and Gold on May 19th

EUR/USD

Analysis: Since February, the EUR/USD chart has been forming an upward wave. Over the past month and a half, a corrective segment (B) has been developing within this wave, which remains incomplete. A week ago, the price broke through a strong support level, which now acts as resistance. Several indicators suggest the correction wave is in its final stage.

Forecast: This week, the euro is expected to trade within a narrow range between the nearest opposing zones. In the first days of the week, some upward movement toward resistance is likely, possibly even a brief breakout above it. Afterward, a reversal and a return to a downward trajectory are expected.
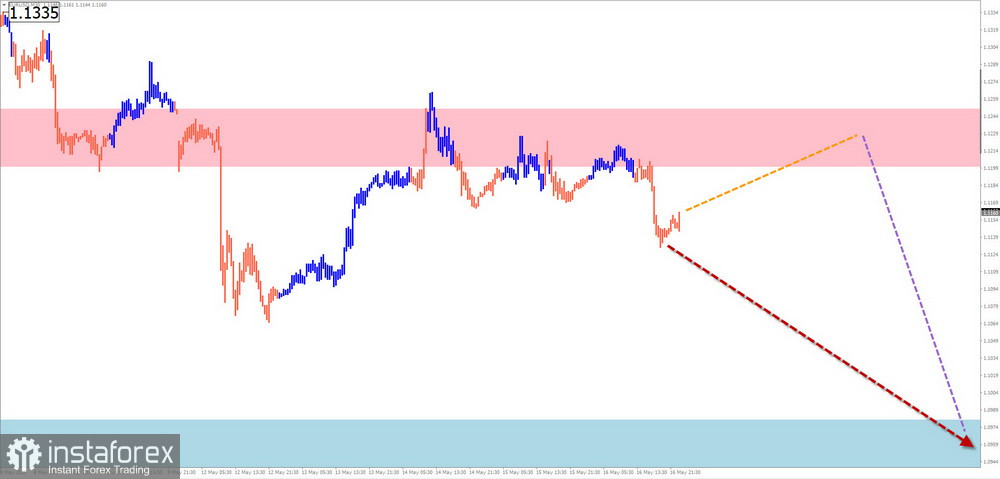
This image is no longer relevant

Reversal Zones:

  • Resistance: 1.1200 / 1.1250
  • Support: 1.0980 / 1.0930

Recommendations:

  • Buying: No conditions for long positions.
  • Selling: Could become the main strategy after confirmed reversal signals near resistance. Downside potential is limited by support.

USD/JPY

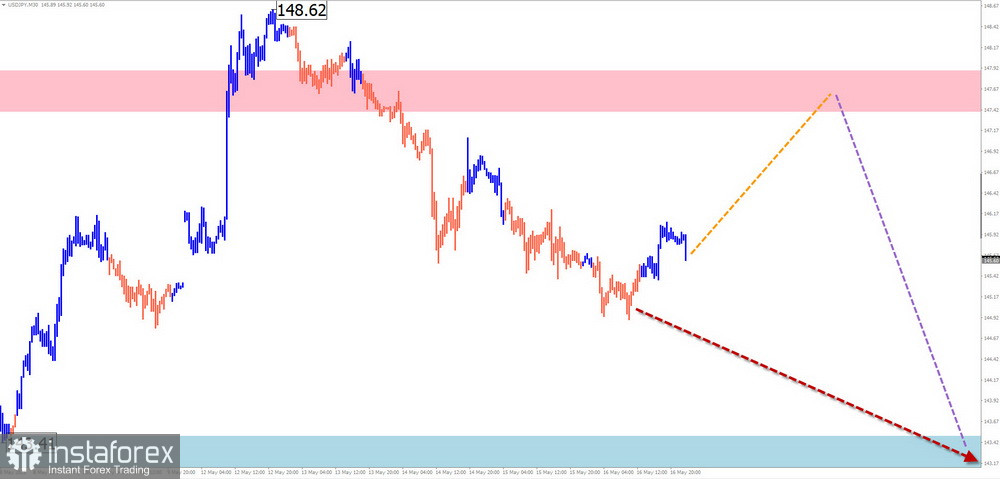
Analysis: Since December, USD/JPY has been moving within a downward wave. Since late April, a corrective segment has been forming. The downward leg starting from May 12 carries potential for a trend reversal. If confirmed, a shift in short-term trend may follow.

Forecast: A weak upward correction is expected early in the week, potentially reaching the resistance zone. Reversal conditions may form in that area, with renewed downward movement likely closer to the weekend.

This image is no longer relevant

Reversal Zones:

  • Resistance: 147.40 / 147.90
  • Support: 143.50 / 143.00

Recommendations:

  • Buying: Risky and limited in potential.
  • Selling: Can be initiated after reversal signals appear near resistance on your chosen strategy.

GBP/JPY

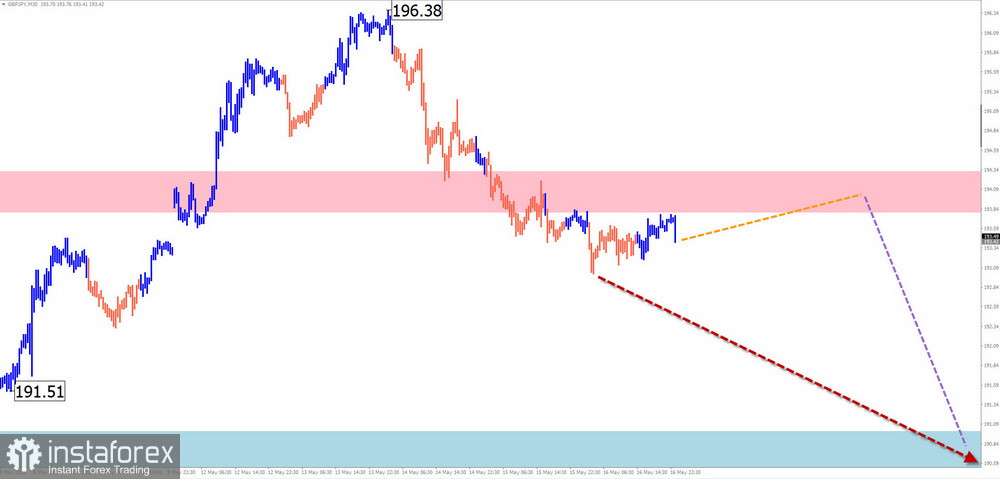
Analysis: The GBP/JPY cross has been following a sideways-uptrend pattern since last summer. A new segment started in early April and is currently undergoing a corrective wave (B) since early May. The structure resembles a contracting flat.

Forecast: Expect a flat movement early in the week with possible testing of the resistance upper boundary. Bearish momentum is more likely in the second half of the week. Volatility may spike during economic data releases.

This image is no longer relevant

Reversal Zones:

  • Resistance: 193.80 / 194.30
  • Support: 191.00 / 190.50

Recommendations:

  • Buying: High risk, limited potential.
  • Selling: Premature before confirmed reversal signals.

USD/CAD

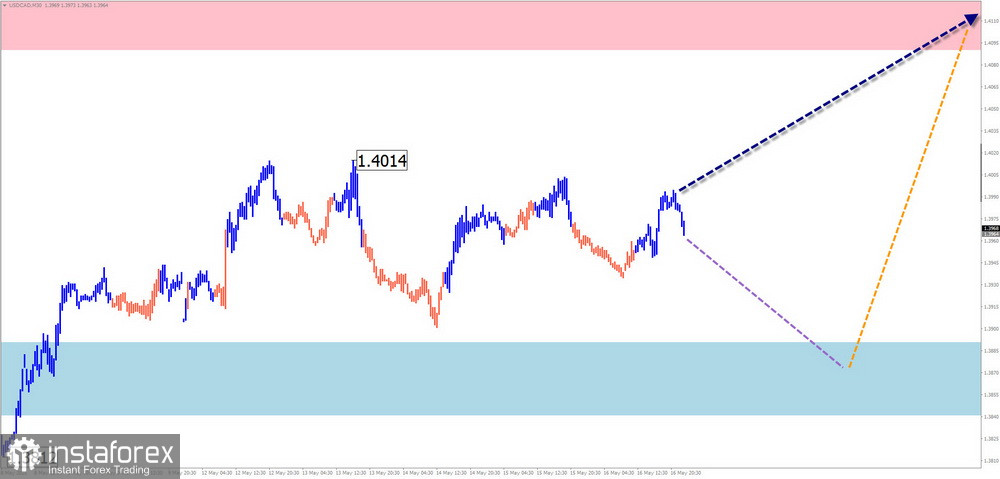
Analysis: Since February, USD/CAD has been trending downward. Recently, a corrective phase has developed, with prices consolidating in a temporary pullback last week.

Forecast: A continuation of the downward trend is likely early in the week, targeting the support zone. Later in the week, a reversal to the upside is possible, with potential growth toward resistance.

This image is no longer relevant

Reversal Zones:

  • Resistance: 1.4090 / 1.4140
  • Support: 1.3890 / 1.3840

Recommendations:

  • Selling: Viable in small positions during individual sessions.
  • Buying: Appropriate only after confirmed reversal signals appear near support.

NZD/USD

Brief Analysis: NZD/USD has been forming a bullish wave since late April. Last week, a corrective pattern (contracting flat) began developing. The downward segment from May 16 has reversal potential.

Weekly Forecast: A bullish tone is expected early in the week, with resistance marking the potential peak. A trend reversal is more likely in the second half, with price declines toward the support zone.
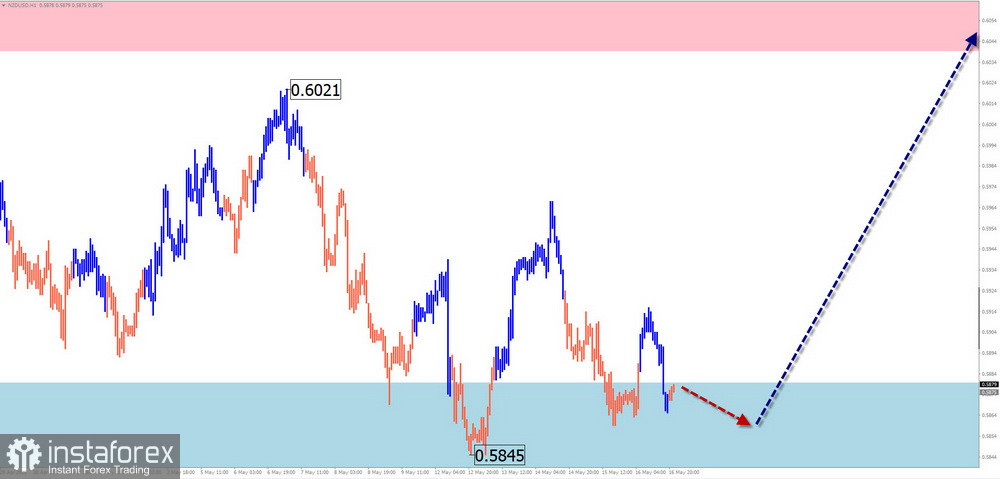
This image is no longer relevant

Reversal Zones:

  • Resistance: 0.6040 / 0.6090
  • Support: 0.5880 / 0.5830

Recommendations:

  • Buying: Possible in small volumes within certain sessions.
  • Selling: Relevant after confirmed reversal signals near resistance.

Gold

Analysis: Gold has followed a bullish wave trend for years. Since late April, a correction has been unfolding from the upper boundary of a strong resistance zone. A short-term pullback is currently underway. The upper boundary of the daily TF reversal zone lies near support.

Forecast: After pressure near resistance early in the week, a reversal and renewed downward movement is likely. Active selling is most probable later in the week, especially alongside major economic news.
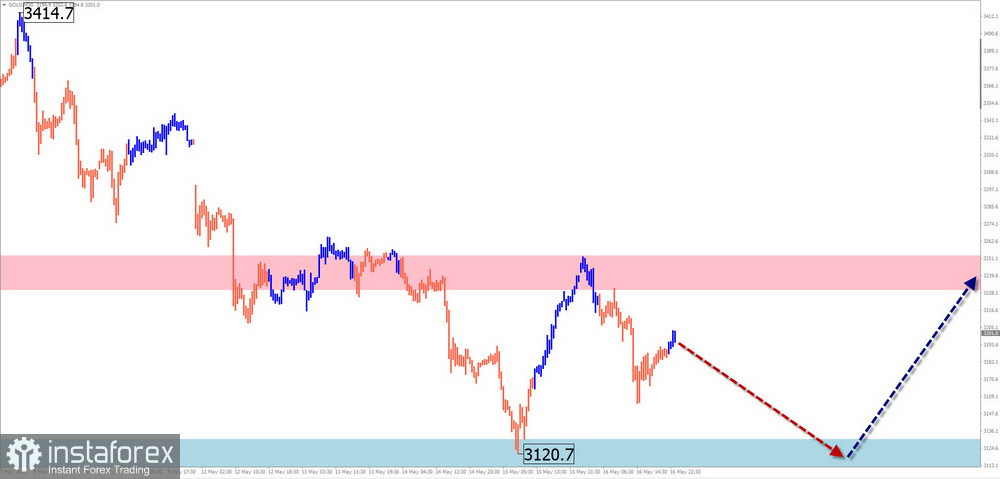
This image is no longer relevant

Reversal Zones:

  • Resistance: 3230.0 / 3250.0
  • Support: 3130.0 / 3110.0

Recommendations:

  • Buying: High risk, limited upside.
  • Selling: May be initiated after confirmed reversal signals near resistance.

Explanations: Simplified Wave Analysis (SWA) assumes all waves consist of three segments (A-B-C). Only the last unfinished wave is analyzed at each timeframe. Dashed lines show expected price movements.

Attention: The wave algorithm does not account for the duration of price movements in time.

Isabel Clark,
Analytical expert of InstaTrade
© 2007-2025

Recommended Stories

EUR/USD Analysis on August 25, 2025

The wave pattern on the 4-hour chart of EUR/USD has not changed for several months, which is encouraging. Even during the formation of corrective waves, the integrity of the structure

Chin Zhao 19:10 2025-08-25 UTC+2

GBP/USD Analysis on August 25, 2025

For GBP/USD, the wave pattern continues to indicate the development of a bullish impulse structure. The wave picture is almost identical to EUR/USD since the only "driving force" remains

Chin Zhao 19:08 2025-08-25 UTC+2

Weekly Forecast Based on Simplified Wave Analysis for GBP/USD, AUD/USD, USD/CHF, EUR/JPY, AUD/JPY, #Ethereum, and US Dollar Index as of August 25th

At the start of the coming week, the British pound may show a short-term sideways movement with a downward bias. Pressure on support, with a brief breakout of its lower

Isabel Clark 12:16 2025-08-25 UTC+2

Weekly Forecast Based on Simplified Wave Analysis for EUR/USD, USD/JPY, GBP/JPY, USD/CAD, NZD/USD, GOLD, and Bitcoin as of August 25th

During the upcoming week, the euro is expected to move within the corridor between the nearest opposing zones. In the first days, growth of the pair and pressure on resistance

Isabel Clark 12:10 2025-08-25 UTC+2

EUR/USD Analysis on August 22, 2025

The wave pattern on the 4-hour chart for EUR/USD has remained unchanged for several months, which is very encouraging. Even when corrective waves are formed, the integrity of the structure

Chin Zhao 22:02 2025-08-22 UTC+2

GBP/USD Analysis on August 22, 2025

For GBP/USD, the wave pattern continues to indicate the development of an upward impulsive wave structure. The wave configuration is almost identical to that of EUR/USD since the only true

Chin Zhao 16:04 2025-08-22 UTC+2

EUR/USD Analysis on August 21, 2025

The wave pattern on the 4-hour chart for EUR/USD has remained unchanged for several months now, which is encouraging. Even during the formation of corrective waves, the integrity

Chin Zhao 18:15 2025-08-21 UTC+2

GBP/USD Analysis on August 21, 2025

The wave pattern for GBP/USD continues to indicate the formation of a bullish impulse structure. The wave picture is nearly identical to that of EUR/USD, as the only "driving force"

Chin Zhao 18:10 2025-08-21 UTC+2

EUR/USD Analysis on August 20, 2025

The wave pattern on the 4-hour chart of EUR/USD has remained unchanged for several months now, which is very encouraging. Even when corrective waves form, the integrity of the structure

Chin Zhao 18:40 2025-08-20 UTC+2

GBP/USD Analysis on August 20, 2025

For GBP/USD, the wave structure still indicates the development of an upward impulse sequence. The wave pattern is almost identical to EUR/USD, since the only "driver of the show" remains

Chin Zhao 18:39 2025-08-20 UTC+2
Can't speak right now?
Ask your question in the chat.
 

Dear visitor,

Your IP address shows that you are currently located in the USA. If you are a resident of the United States, you are prohibited from using the services of InstaFintech Group including online trading, online transfers, deposit/withdrawal of funds, etc.

If you think you are seeing this message by mistake and your location is not the US, kindly proceed to the website. Otherwise, you must leave the website in order to comply with government restrictions.

Why does your IP address show your location as the USA?

  • - you are using a VPN provided by a hosting company based in the United States;
  • - your IP does not have proper WHOIS records;
  • - an error occurred in the WHOIS geolocation database.

Please confirm whether you are a US resident or not by clicking the relevant button below. If you choose the wrong option, being a US resident, you will not be able to open an account with InstaTrade anyway.

We are sorry for any inconvenience caused by this message.