empty
28.05.2025 11:32 AM
Forecast for EUR/USD on May 28, 2025
On Tuesday, the EUR/USD pair consolidated below the 1.1374–1.1380 zone and then rebounded from it from below. This confirms the continuation of the downward move, and a close below the 50.0% retracement level at 1.1320 suggests the pair may continue to decline toward the 1.1260–1.1282 zone. A rebound from any level or support zone could spark a renewed bullish advance, preserving the uptrend.

This image is no longer relevant

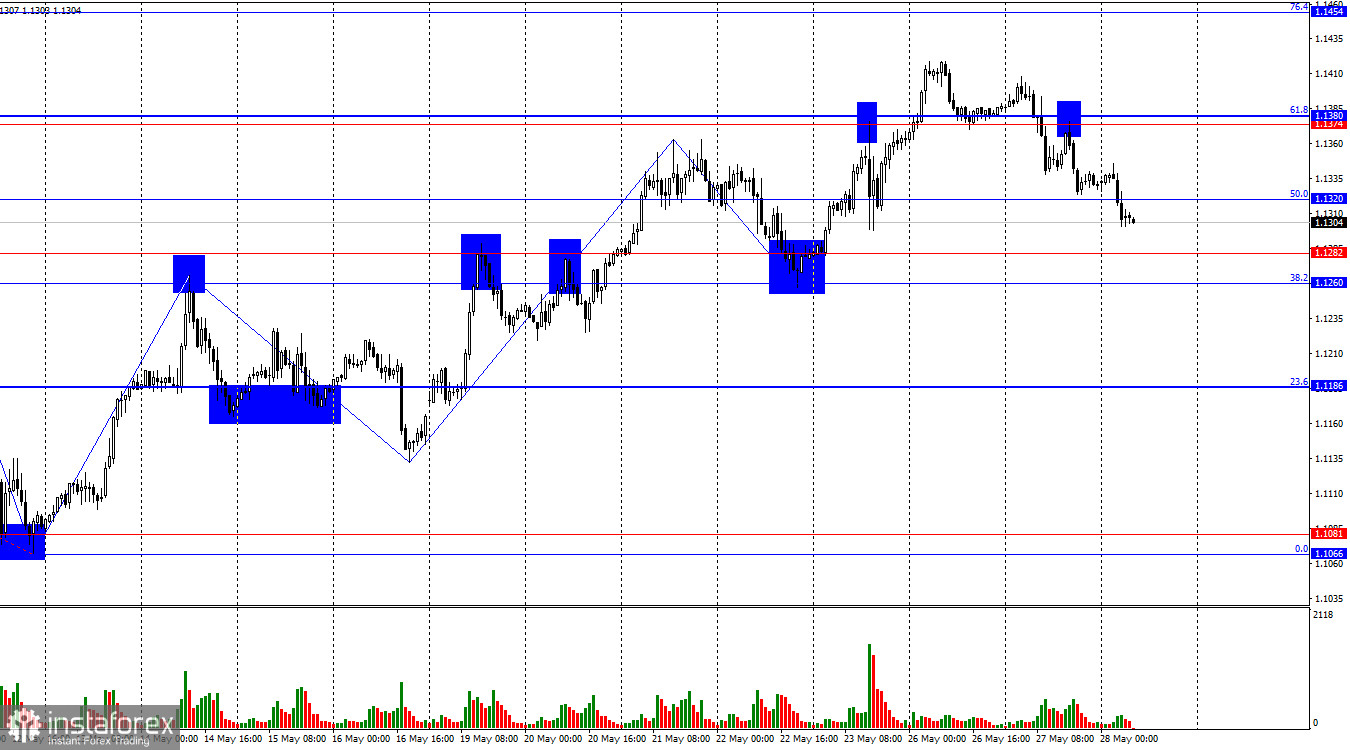
The wave pattern on the hourly chart has shifted. The most recent upward wave broke above the previous high, and the last completed downward wave failed to break the previous low. This confirms a bullish trend. The current trend can only be considered over if the pair consolidates below the 1.1260–1.1282 support zone. That would mark a new downward wave breaking the previous low.

Recent news of the suspension of tariff hikes for the EU supported the bears, but it may not be enough to break the bullish trend. The fundamental backdrop on Tuesday again favored the bears for the second day in a row. The only report of the day—on U.S. durable goods orders—came out better than expected. However, the data was not genuinely positive, as April orders fell by 6.3% following a 7.6% surge in March. This signals the impact of Donald Trump's tariffs is beginning to show in economic indicators—and not in the best way. U.S. GDP declined by 0.3% in Q1, a rare occurrence in recent years.

As a result, bears may soon run out of steam. We won't speculate on when that might happen. For now, the bullish trend remains intact, with no graphic signs of a reversal. If they emerge, then we can reassess for a potential bearish shift.

This image is no longer relevant

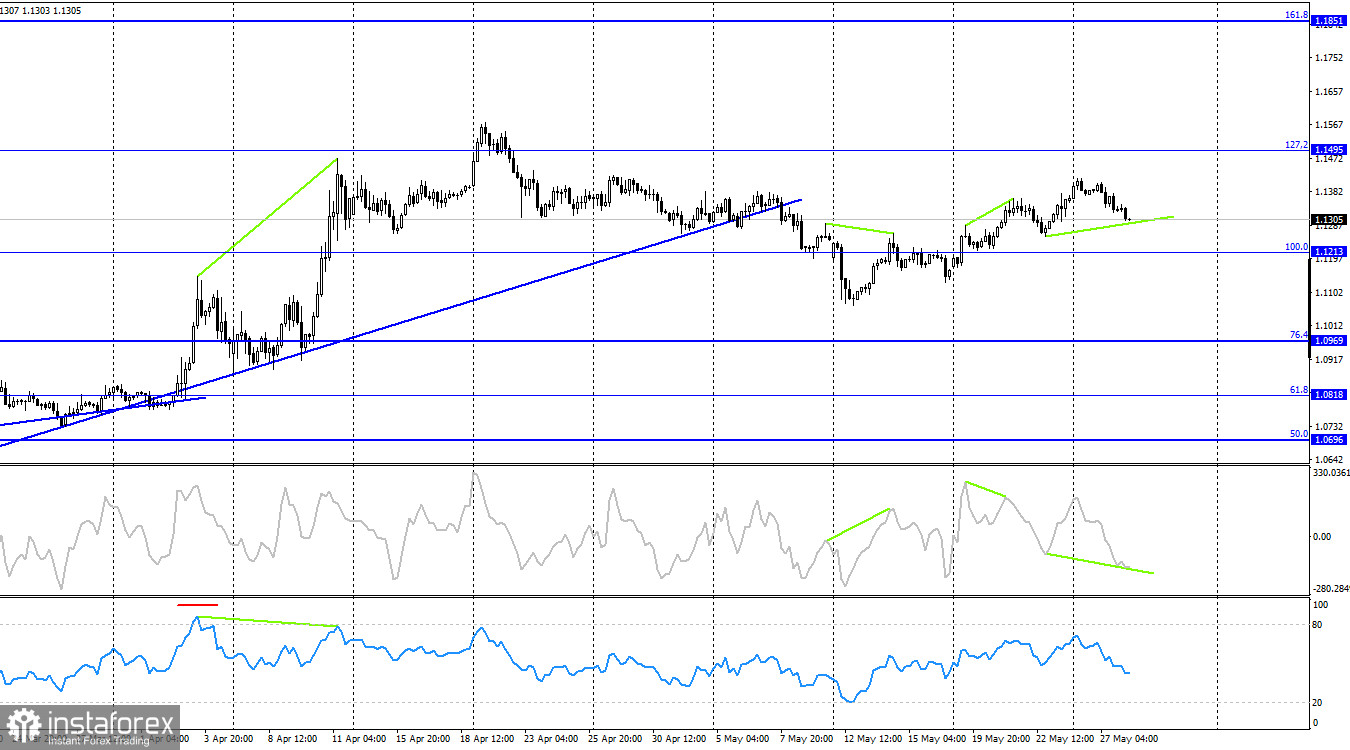
On the H4 chart, the pair has turned in favor of the euro and continues rising toward the 127.2% Fibonacci level at 1.1495. A previous bearish divergence resulted in only a minor pullback. A bullish divergence is forming on the CCI indicator, which could halt the local decline and support a new upward move.

Commitments of Traders (COT) Report

This image is no longer relevant

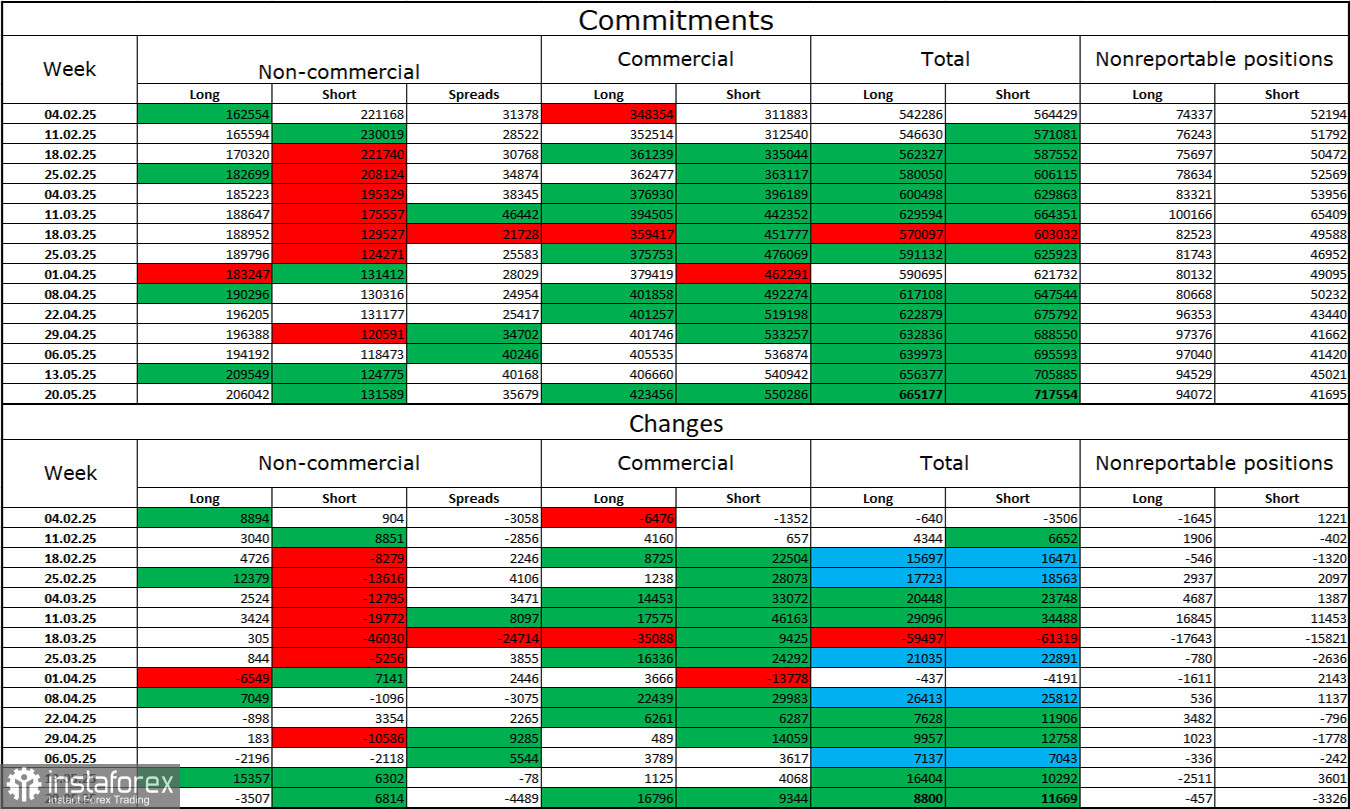
In the most recent COT report, long positions held by speculators declined by 3,507. Short positions rose by 6,814. Net positioning remains bullish, largely due to Donald Trump's policies.

There are currently 206,000 long positions versus 132,000 short positions. The gap continues to widen in favor of the bulls. This means the euro remains in demand, while the dollar does not. The trend has persisted for 16 consecutive weeks, with large players reducing short exposure and increasing longs.

The divergence in monetary policy between the ECB and the Fed continues to favor the dollar on paper, but Trump's trade policies overshadow this advantage, threatening to push the U.S. into recession with long-term consequences.

News Calendar – May 28

  • EU: German Unemployment Rate (07:55 UTC)
  • U.S.: FOMC Meeting Minutes (18:00 UTC)

The economic calendar for Wednesday includes two key entries. However, the fundamental impact is expected to be weak. Bears are unlikely to get the support they need from these events.

EUR/USD Forecast and Trading Tips

Short positions were valid after a close below the 1.1374–1.1380 zone, targeting 1.1320 and 1.1282. The first target has already been reached. Long positions are advisable on a rebound from the 1.1260–1.1282 support zone (hourly chart), with targets at 1.1320 and back toward 1.1374–1.1380. The bears are attacking, but their momentum may be fading.

Fibonacci Levels:

  • Hourly chart: based on 1.1574–1.1066
  • 4-hour chart: based on 1.1214–1.0179
Samir Klishi,
Analytical expert of InstaTrade
© 2007-2025

Recommended Stories

GBP/USD. Indicator Analysis on August 15, 2025

On Thursday, the pair moved downward, tested the 85.4% retracement level at 1.3522 (red dotted line), and closed the daily candle at 1.3526. Today, the pair may start moving upward

Stefan Doll 11:33 2025-08-15 UTC+2

EUR/USD. Indicator Analysis on August 15, 2025

On Thursday, the pair moved down, tested the 21-period EMA at 1.1632 (thin black line), and then moved upward, closing the daily candle at 1.1646. Today, the pair may begin

Stefan Doll 11:25 2025-08-15 UTC+2

Forex forecast 14/08/2025: EUR/USD, USD/JPY, GBP/USD, AUD/USD, Ethereum and Bitcoin

Useful links: My other articles are available in this section InstaForex course for beginners Popular Analytics Open trading account Important: The begginers in forex trading need to be very careful

Sebastian Seliga 09:07 2025-08-15 UTC+2

GBP/USD Forecast for August 15, 2025

Yesterday's U.S. producer inflation data for July showed a sharp jump: 0.9% for the month and 3.3% y/y versus 2.4% y/y the previous month. The probability of a September Federal

Laurie Bailey 05:01 2025-08-15 UTC+2

EUR/USD Forecast for August 15, 2025

The euro has now reached Fibonacci time line No. 8 — and it has arrived with a pessimistic mood. Yesterday, the support level at 1.1632 was tested, and the Marlin

Laurie Bailey 05:01 2025-08-15 UTC+2

AUD/USD Forecast for August 15, 2025

After yesterday's sharp drop of more than 50 pips, it has become clear that the breakout and consolidation above the balance line (blue rectangle) was false, which now shifts

Laurie Bailey 04:53 2025-08-15 UTC+2

EUR/USD – August 14th. Friday will be decisive

On Wednesday, the EUR/USD pair continued its upward movement and consolidated above the 76.4% retracement level at 1.1695. This suggests that the euro may continue rising today toward the next

Samir Klishi 11:57 2025-08-14 UTC+2

GBP/USD – August 14th. The UK economy delivers positive news

On the hourly chart, the GBP/USD pair continued its upward move on Wednesday and reached the 100.0% retracement level at 1.3586, which borders the resistance area of 1.3611–1.3620. A rebound

Samir Klishi 11:15 2025-08-14 UTC+2

EUR/USD. Indicator Analysis on August 14, 2025

On Wednesday, the pair, moving upward, tested the 85.4% retracement level at 1.1731 (yellow dashed line) and then declined, closing the daily candle at 1.1704. Today, the price may begin

Stefan Doll 11:00 2025-08-14 UTC+2

GBP/USD. Indicator Analysis on August 14, 2025

On Wednesday, the pair, moving upward, tested the upper fractal at 1.3587 (red dashed line) and then retreated slightly, closing the daily candle at 1.3571. Today, the price may begin

Stefan Doll 10:48 2025-08-14 UTC+2
Can't speak right now?
Ask your question in the chat.
 

Dear visitor,

Your IP address shows that you are currently located in the USA. If you are a resident of the United States, you are prohibited from using the services of InstaFintech Group including online trading, online transfers, deposit/withdrawal of funds, etc.

If you think you are seeing this message by mistake and your location is not the US, kindly proceed to the website. Otherwise, you must leave the website in order to comply with government restrictions.

Why does your IP address show your location as the USA?

  • - you are using a VPN provided by a hosting company based in the United States;
  • - your IP does not have proper WHOIS records;
  • - an error occurred in the WHOIS geolocation database.

Please confirm whether you are a US resident or not by clicking the relevant button below. If you choose the wrong option, being a US resident, you will not be able to open an account with InstaTrade anyway.

We are sorry for any inconvenience caused by this message.