empty
17.06.2025 12:00 PM
Forecast for EUR/USD on June 17, 2025

On Monday, the EUR/USD pair continued its upward movement, consolidated above the 100.0% corrective level at 1.1574, but was unable to continue rising afterward. A close below the 1.1574 level opens the door to a potential decline toward the 76.4% corrective level at 1.1454. A new consolidation above the Fibonacci level of 1.1574 will support the euro and the continuation of growth toward the 1.1645 level.

This image is no longer relevant

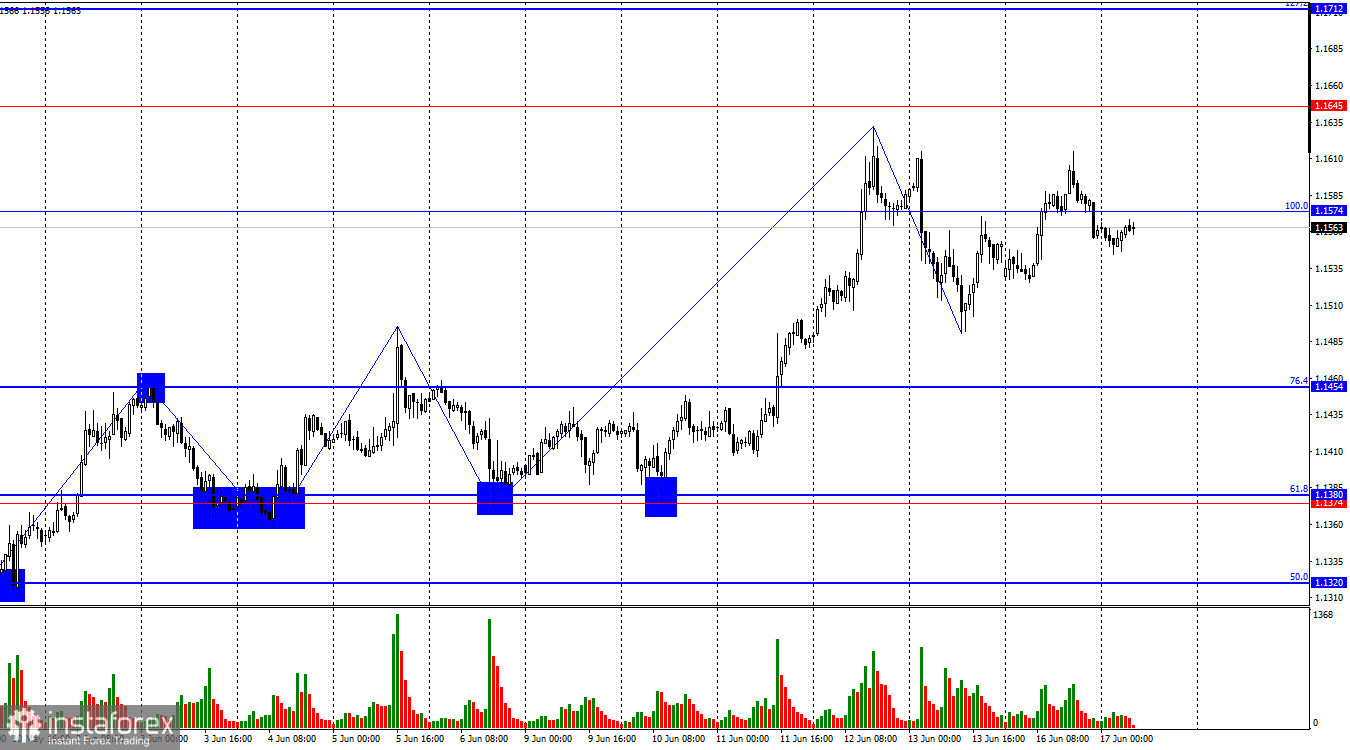
The wave pattern on the hourly chart remains clear. The last completed downward wave did not break the previous low, while the last completed upward wave easily broke the previous high. Thus, the trend currently remains bullish. The latest news about increased tariffs on steel and aluminum caused the bears to retreat again, and the lack of real progress in U.S.–China negotiations keeps bears from initiating new attacks. The trend will only be considered bearish if the pair firmly consolidates below the 1.1490 level.

There was no economic news on Monday, yet the bulls continued to push upward amid the ongoing Middle East conflict. As of Tuesday morning, there is no reason to expect an end to the conflict any time soon. First, this conflict has persisted for years. Second, Iran remains steadfast in retaining its status as a nuclear power. Tehran views nuclear weapons as a means of defense, while the U.S. and Israel see them as a potential offensive threat. As a result, the sides are far from signing a lasting agreement to bring peace to the region. For the dollar, an escalation in the Middle East is once again bad news. The dollar has lost its status as a safe haven, so the market now prefers truly safe currencies — and there are alternatives. Therefore, bulls are unlikely to push forward solely due to the conflict between Iran and Israel, but bears also seem unable to launch a full-scale offensive.

This image is no longer relevant

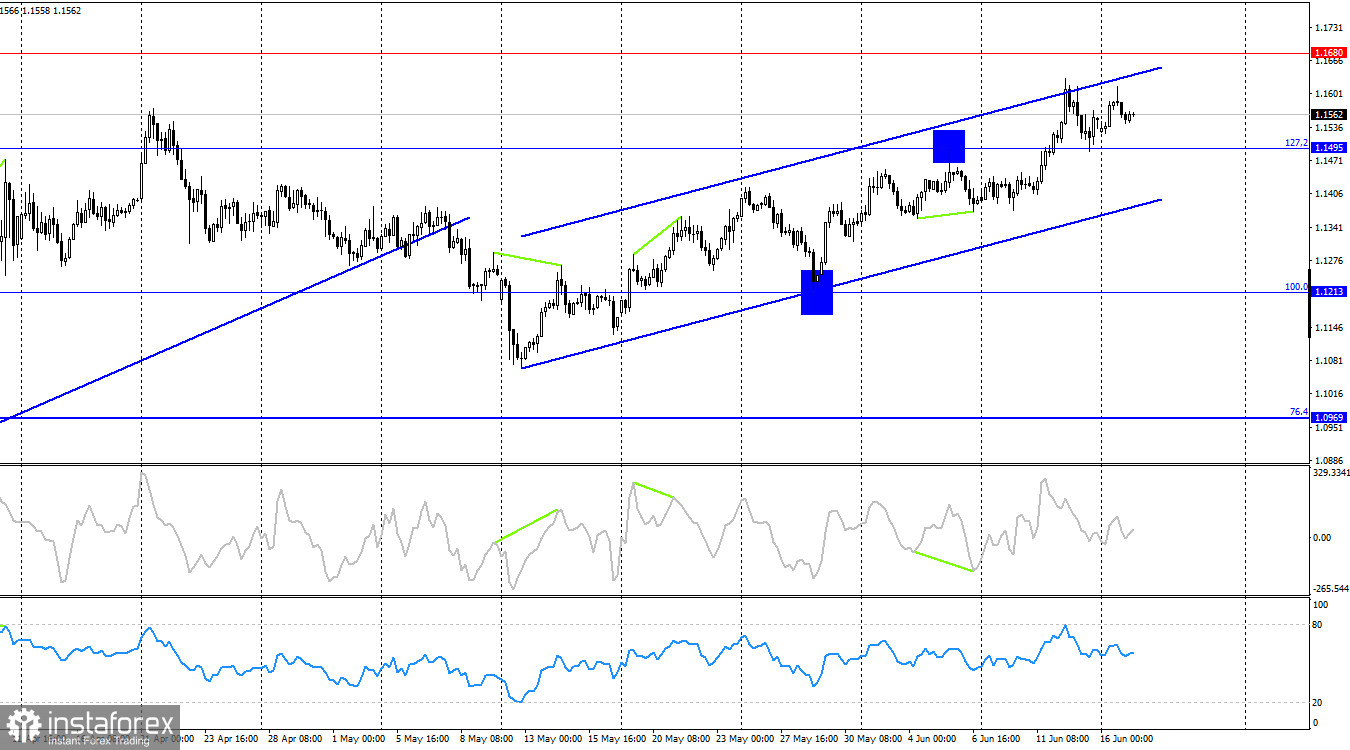
On the 4-hour chart, the pair consolidated above the 127.2% corrective level at 1.1495 and rebounded from it. This suggests that the euro may continue rising toward the next level at 1.1680. The upward channel clearly indicates that the bullish trend remains intact. A consolidation below the 1.1495 level would signal a potential reversal in favor of the U.S. dollar and a decline toward the lower boundary of the channel. No developing divergences are currently observed on any indicator.

COT (Commitments of Traders) Report

This image is no longer relevant

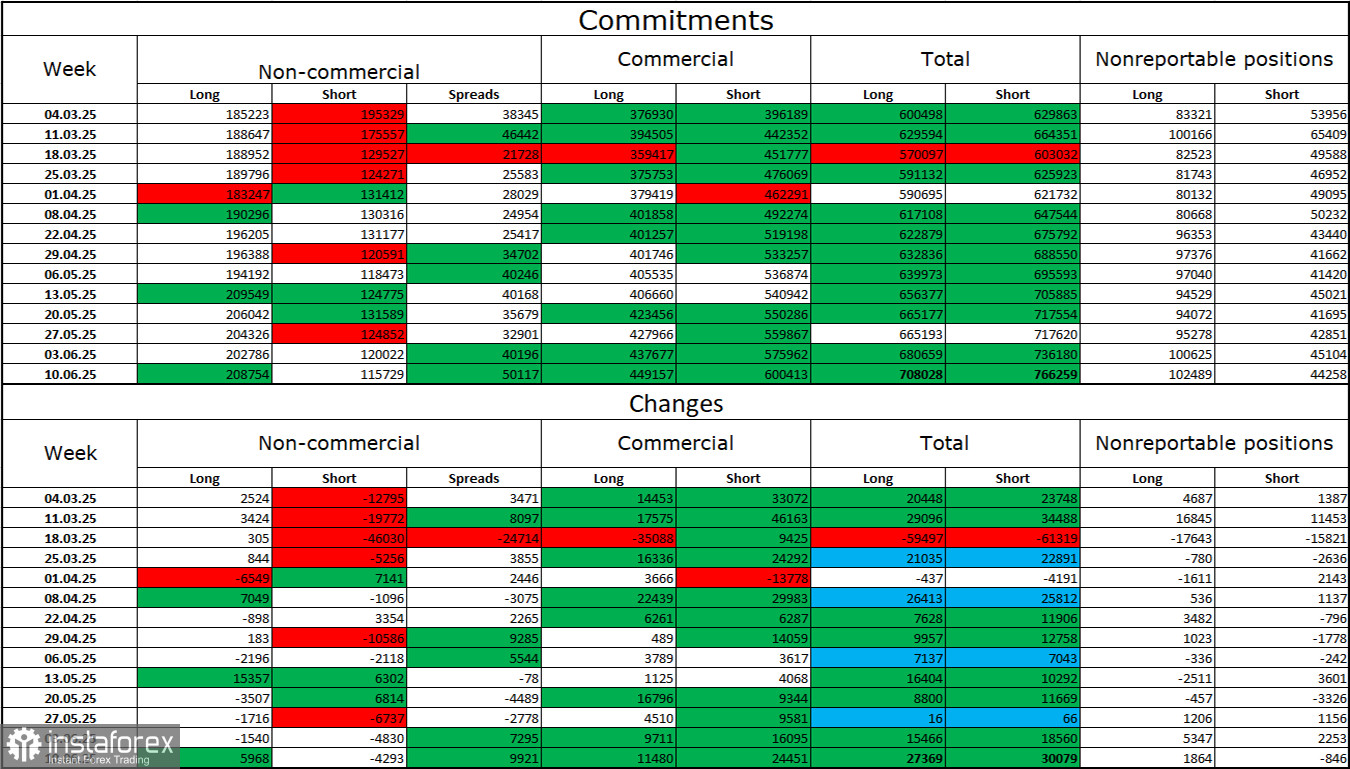
During the latest reporting week, professional traders opened 5,968 long positions and closed 4,293 short positions. The sentiment of the "Non-commercial" group remains bullish, largely due to Donald Trump. The total number of long positions held by speculators now stands at 208,000, while short positions total 115,000 — and the gap continues to widen (with rare exceptions). This indicates sustained demand for the euro and weak demand for the dollar. The situation remains unchanged.

For 19 consecutive weeks, large players have been reducing their short positions and increasing their longs. Although the divergence in monetary policy between the ECB and the Fed is already quite significant, Donald Trump's policies are a more influential factor for traders. His actions risk triggering a recession in the U.S. economy and other long-term structural problems.

Economic Calendar (June 17)

  • EU: ZEW Economic Sentiment Index (09:00 UTC)
  • Germany: ZEW Economic Sentiment Index (09:00 UTC)
  • U.S.: Retail Sales (12:30 UTC)
  • U.S.: Industrial Production (12:30 UTC)

The June 17 calendar contains four entries, none of which are considered major. Therefore, the impact of the news background on market sentiment on Tuesday is expected to be minimal.

EUR/USD Forecast and Trader Tips

Sales were possible upon a close below the 1.1574 level on the hourly chart, targeting 1.1454. These trades can remain open. I would recommend buying in the case of a rebound from the 1.1454 level with a target of 1.1574, or upon a close above 1.1574, targeting 1.1645.

Fibonacci Levels

  • Hourly chart: 1.1574 – 1.1066
  • 4-hour chart: 1.1214 – 1.0179
Samir Klishi,
Analytical expert of InstaTrade
© 2007-2025

Recommended Stories

EUR/USD Forecast for August 20, 2025

Yesterday, the euro closed the day with a 14-pip decline. The price spent much of the time trying to overcome the balance line on the daily chart, so the support

Laurie Bailey 04:52 2025-08-20 UTC+2

GBP/USD Forecast for August 20, 2025

Yesterday, the British pound consolidated below the balance indicator line on the daily chart. This signals a shift in speculators' interest toward selling. The price will now attempt to break

Laurie Bailey 04:52 2025-08-20 UTC+2

Silver Forecast for August 20, 2025

During today's Pacific session, silver quotes reached the target support at 37.17. Prior to that (yesterday), the price made a strong downward move, breaking through the balance and MACD indicator

Laurie Bailey 04:52 2025-08-20 UTC+2

EUR/JPY Forecast for August 20, 2025

Over the past two days, the EUR/JPY pair has been pressing against the target support at 171.32 (the July 22 low). The Marlin oscillator is actively supporting this move, helping

Laurie Bailey 04:52 2025-08-20 UTC+2

XAU/USD. Analysis and Forecast

Gold is losing its appeal today. The drop in prices last week below the 100-SMA on the 4-day chart, the failure to overcome it this week, as well

Irina Yanina 19:01 2025-08-19 UTC+2

Forecast for EUR/USD on August 19, 2025

On Monday, the EUR/USD pair reversed in favor of the U.S. currency and returned to the support zone of 1.1637–1.1645. A rebound of quotes from this zone will favor

Samir Klishi 11:05 2025-08-19 UTC+2

Forecast for GBP/USD on August 19, 2025

On the hourly chart, the GBP/USD pair on Monday resumed its decline after rebounding from the 100.0% retracement level of 1.3586 last week. Thus, I expect the decline to continue

Samir Klishi 11:00 2025-08-19 UTC+2

GBP/USD. Indicator Analysis on August 19, 2025

On Monday, the pair moved downward, breaking below the 5-day EMA at 1.3509 (thin red line), and closed the daily candle at 1.3500. Today, the price will attempt to continue

Stefan Doll 10:47 2025-08-19 UTC+2

EUR/USD. Indicator Analysis on August 19, 2025

On Monday, the pair moved downward, testing the 8-day EMA at 1.1658 (thin blue line), and closed the daily candle at 1.1659. Today, the price may continue to move lower

Stefan Doll 10:45 2025-08-19 UTC+2

Forex forecast 19/08/2025: EUR/USD, NZD/USD, USD/JPY, Gold, Ethereum and Bitcoin

Useful links: My other articles are available in this section InstaForex course for beginners Popular Analytics Open trading account Important: The begginers in forex trading need to be very careful

Sebastian Seliga 10:07 2025-08-19 UTC+2
Can't speak right now?
Ask your question in the chat.
 

Dear visitor,

Your IP address shows that you are currently located in the USA. If you are a resident of the United States, you are prohibited from using the services of InstaFintech Group including online trading, online transfers, deposit/withdrawal of funds, etc.

If you think you are seeing this message by mistake and your location is not the US, kindly proceed to the website. Otherwise, you must leave the website in order to comply with government restrictions.

Why does your IP address show your location as the USA?

  • - you are using a VPN provided by a hosting company based in the United States;
  • - your IP does not have proper WHOIS records;
  • - an error occurred in the WHOIS geolocation database.

Please confirm whether you are a US resident or not by clicking the relevant button below. If you choose the wrong option, being a US resident, you will not be able to open an account with InstaTrade anyway.

We are sorry for any inconvenience caused by this message.