empty
23.06.2025 04:56 AM
Oil Forecast for June 23, 2025

Crude Oil (CL)

On the weekly chart, the signal line of the Marlin oscillator has begun to reverse from the 9.3600 level. Historically, this level has marked significant downward reversals—in April 2023, October 2021, and April 2019. Breakouts above this level have varied: some were strong (e.g., August 2023, February 2022), while others were weak and merely noise.

This image is no longer relevant

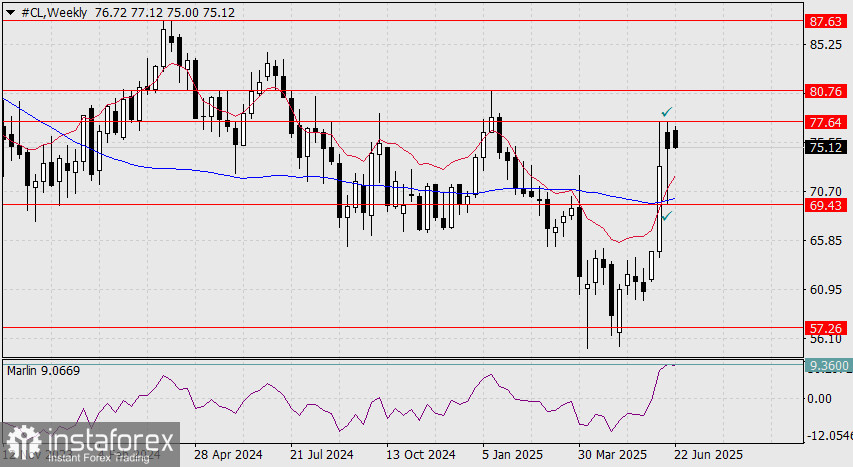
The current situation indicates the price is at a crossroads: continued geopolitical tension could drive further price increases, while declining global demand may lead to a reversal.

A consolidation above last week's high at 77.64 would support a geopolitically driven upward move. A decline below last week's low at 69.43, which would also mean a break below the MACD line support, would signal the start of a bearish scenario. Both scenarios are equally probable. Growth targets: 80.76 – high in January, 87.63 – high in April 2024. Downside target: 57.26 – low in March 2021.

This image is no longer relevant

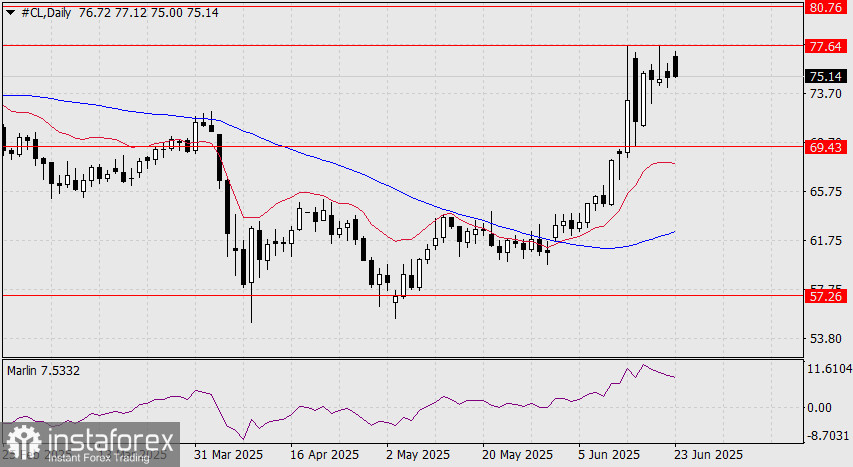
In the daily timeframe, the Marlin oscillator has entered the overbought zone. The last stronger impulse was in March 2022, when the price surged to 130.44. However, the current sharp reversal of the oscillator from the oversold zone may indicate a discharge before further growth.

Thus, key indicators for price movement are a breakout and consolidation above 77.64 or a drop and consolidation below 69.43.

This image is no longer relevant

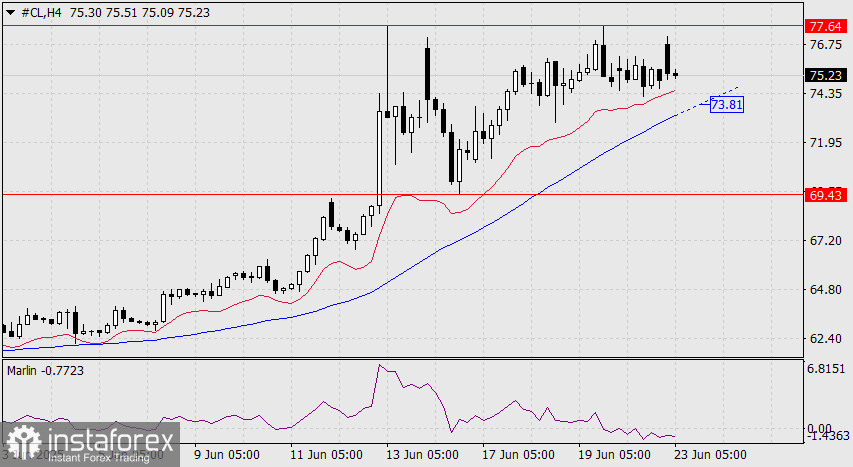
A primary signal of a downward reversal could be the price consolidating below the MACD line at 73.81 on the H4 chart.

Laurie Bailey,
Analytical expert of InstaTrade
© 2007-2025

Recommended Stories

USD/JPY. Analysis and Forecast

From a technical perspective, spot prices remain within the weekly trading range. However, it is too early to confirm a full bearish consolidation, as oscillators on the daily chart remain

Irina Yanina 13:58 2025-08-08 UTC+2

Forecast for EUR/USD on August 8, 2025

On Thursday, the EUR/USD pair rebounded from the 76.4% retracement level at 1.1695, reversed in favor of the U.S. dollar, and fell below the support zone of 1.1637–1.1645. Today

Samir Klishi 11:10 2025-08-08 UTC+2

GBP/USD. August 8th. The Bank of England's decision leaves the pound largely unaffected

On the hourly chart, the GBP/USD pair continued to rise on Thursday, consolidating above the resistance zone of 1.3357–1.3371 and the level of 1.3425. Thus, on Friday, the upward movement

Samir Klishi 11:02 2025-08-08 UTC+2

GBP/USD. Indicator analysis on August 8, 2025

Trend analysis (Fig. 1). On Friday, from the level of 1.3440 (yesterday's daily candle close), the market may start moving downward toward 1.3378 — the 23.6% retracement level (yellow dashed

Stefan Doll 10:57 2025-08-08 UTC+2

EUR/USD. Indicator analysis on August 8, 2025

On Thursday, the pair, moving upward, tested the 76.4% retracement level at 1.1698 (blue dashed line) and then moved down, closing the daily candle at 1.1664. Today, the pair

Stefan Doll 10:25 2025-08-08 UTC+2

Forex forecast 08/08/2025: EUR/USD, USD/JPY, GBP/USD, SP500, Ethereum and Bitcoin

Useful links: My other articles are available in this section InstaForex course for beginners Popular Analytics Open trading account Important: The begginers in forex trading need to be very careful

Sebastian Seliga 09:47 2025-08-08 UTC+2

EUR/USD Forecast for August 8, 2025

It appears that the 1.1392–1.1632 range (or slightly higher) is quite comfortable for the euro, with substantial retail buy orders starting to accumulate within it. But therein lies the well-known

Laurie Bailey 04:52 2025-08-08 UTC+2

GBP/USD Forecast for August 8, 2025

Following yesterday's Bank of England decision to cut the rate with a minimal majority (5 to 4), the British pound consolidated above the 1.3364 level, opening the path toward

Laurie Bailey 04:52 2025-08-08 UTC+2

USD/CAD Forecast for August 8, 2025

Yesterday, the Canadian dollar completed a 50% correction of the upward movement from July 23 to August 1. The signal line of the Marlin oscillator began to slow down near

Laurie Bailey 04:44 2025-08-08 UTC+2

Trading Signals for GOLD (XAU/USD) for August 7-9, 2025: sell below $3,400 or $3,373 (21 SMA - 7/8 Murray)

If gold sharply breaks the uptrend channel and consolidates below the 21 SMA, this could be seen as an opportunity to sell, with targets at 3,343, 3,320, and finally

Dimitrios Zappas 17:35 2025-08-07 UTC+2
Can't speak right now?
Ask your question in the chat.
 

Dear visitor,

Your IP address shows that you are currently located in the USA. If you are a resident of the United States, you are prohibited from using the services of InstaFintech Group including online trading, online transfers, deposit/withdrawal of funds, etc.

If you think you are seeing this message by mistake and your location is not the US, kindly proceed to the website. Otherwise, you must leave the website in order to comply with government restrictions.

Why does your IP address show your location as the USA?

  • - you are using a VPN provided by a hosting company based in the United States;
  • - your IP does not have proper WHOIS records;
  • - an error occurred in the WHOIS geolocation database.

Please confirm whether you are a US resident or not by clicking the relevant button below. If you choose the wrong option, being a US resident, you will not be able to open an account with InstaTrade anyway.

We are sorry for any inconvenience caused by this message.