See also

 28.01.2026 08:10 AM
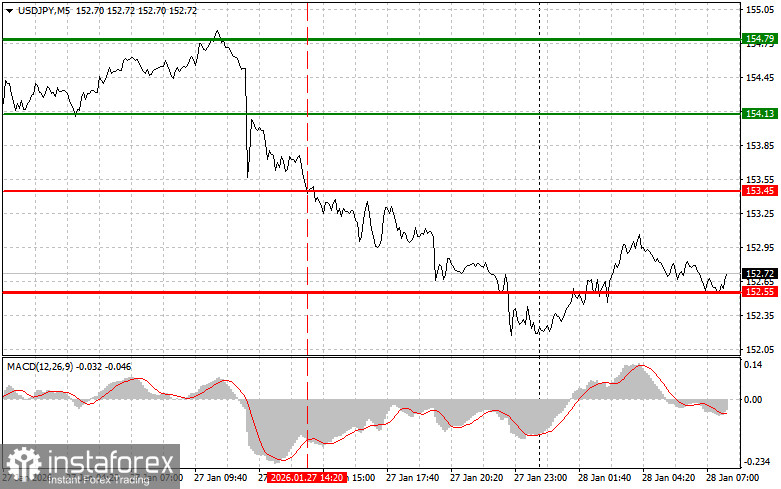
The price test at 153.45 coincided with the MACD indicator moving significantly below the zero mark, which limited the pair's downside potential. For this reason, I did not sell the dollar and missed a normal downward movement.
The Japanese yen returned to gain against the dollar after data indicated a sharp decline in US consumer confidence. The drop in consumer confidence, as recorded by the Conference Board index, heightened concerns about a slowdown in economic growth in the largest world economy. This, in turn, triggered an outflow of investors from the US dollar in favor of other currencies, such as the Japanese yen. Additional support for the yen came from speculation about possible Bank of Japan interventions. Although the central bank maintains a tight monetary policy, it is currently not enough to strengthen the yen, and speculation about currency interventions continues.
Regarding the intraday strategy, I will primarily focus on implementing scenarios #1 and #2.
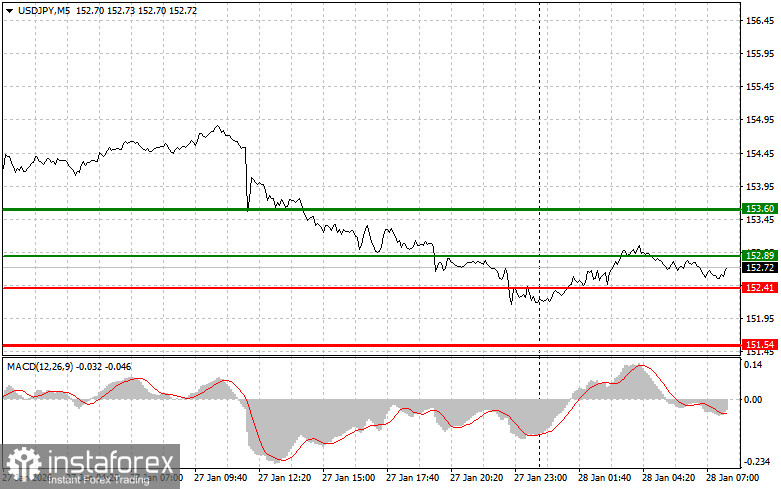
Scenario #1: I plan to buy USD/JPY today at the entry point around 152.89 (the green line on the chart), with a target at 153.60 (the thicker green line on the chart). At the level of 153.60, I intend to exit my long positions and immediately sell in the opposite direction (anticipating a movement of 30-35 pips from the level). It is best to resume buying the pair on corrections and significant pullbacks in USD/JPY. Important! Before buying, ensure that the MACD indicator is above the zero mark and is just starting its ascent from there.
Scenario #2: I also plan to buy USD/JPY today if there are two consecutive tests of the price at 152.41 when the MACD indicator is in oversold territory. This will limit the pair's downside potential and lead to an upward market reversal. A rise can be expected toward opposing levels of 152.89 and 153.60.
Scenario #1: I plan to sell USD/JPY today only after updating the 152.41 level (the red line on the chart), which will trigger a rapid decline in the pair. The key target for sellers will be the level of 151.54, where I intend to exit my shorts and immediately buy in the opposite direction (anticipating a movement of 20-25 pips in the opposite direction from the level). It is better to sell as high as possible. Important! Before selling, ensure that the MACD indicator is below the zero mark and is just starting its descent from there.
Scenario #2: I also plan to sell USD/JPY today if there are two consecutive tests of 152.89 when the MACD indicator is in overbought territory. This will limit the pair's upward potential and lead to a market reversal downward. A decline can be expected toward opposite levels of 152.41 and 151.54.
The thin green line represents the entry price at which one can buy the trading instrument;
The thick green line represents the approximate price where one can set Take Profit or secure profits, as further growth above this level is unlikely;
The thin red line represents the entry price at which one can sell the trading instrument;
The thick red line represents the approximate price where one can set Take Profit or secure profits, as further decline below this level is unlikely;
The MACD indicator: when entering the market, it is important to consider overbought and oversold zones.
Important: Beginner traders in the Forex market should be very careful when making entry decisions. It is best to stay out of the market before important fundamental reports are released to avoid getting caught in sharp price fluctuations. If you decide to trade during news releases, always set stop orders to minimize losses. Without setting stop orders, you can quickly lose your entire deposit, especially if you do not use money management and trade large volumes.
And remember, for successful trading, it is essential to have a clear trading plan, like the one presented above. Making spontaneous trading decisions based on the current market situation is inherently a losing strategy for an intraday trader.


