See also

 28.04.2026 09:56 AM
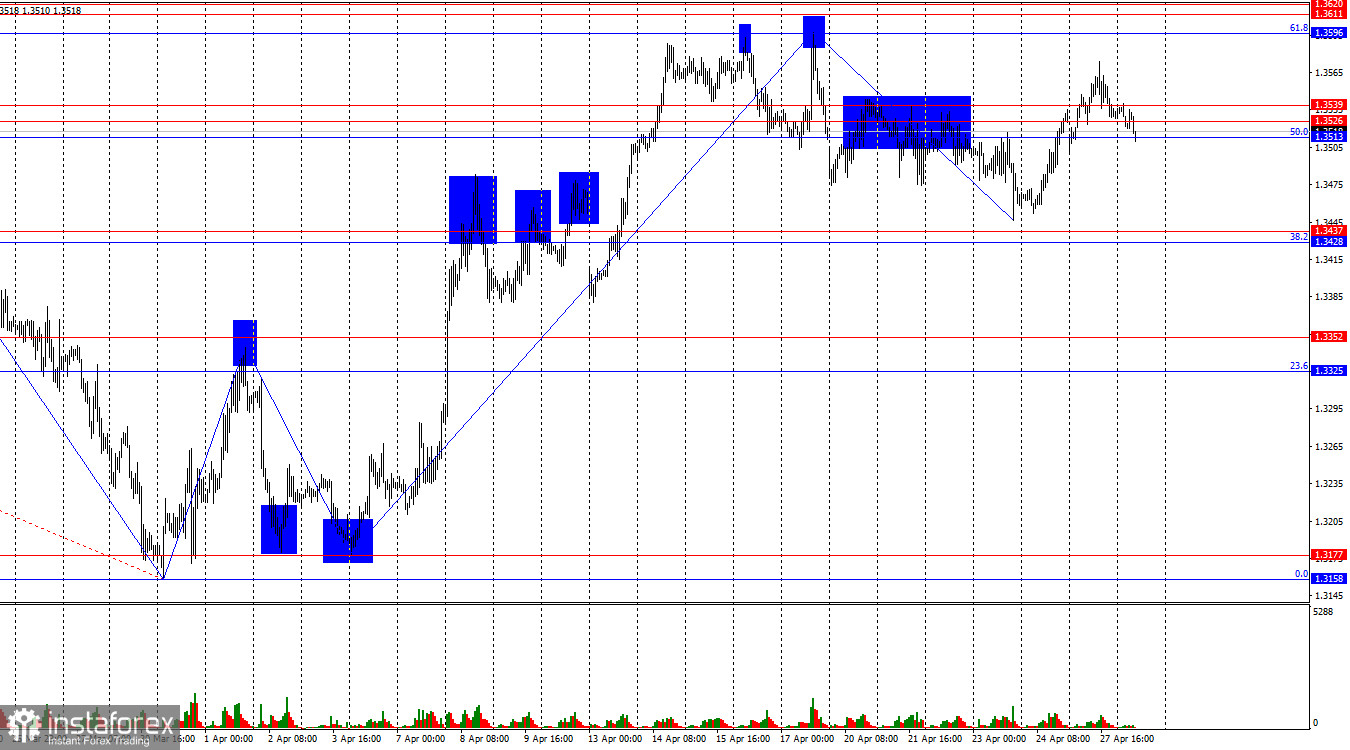
On the hourly chart, the GBP/USD pair on Monday managed to gain a foothold (hold/close) above the resistance level of 1.3513–1.3539, but on Tuesday it returned to it. Thus, a rebound of quotes from this zone would again favor the pound and a resumption of growth toward the resistance level of 1.3596–1.3620. A consolidation below the 1.3513–1.3539 level would allow for expectations of a new decline in the pound toward the support level of 1.3428–1.3437.
The wave situation remains "bullish." The last completed upward wave broke the previous peak, while the new downward wave did not break the previous low. Geopolitics gave the bears almost complete dominance in the market for two months, then the geopolitical backdrop supported the bulls for three weeks. At the moment, the situation in the Middle East is contradictory, so traders are in a pause mode. To break the "bullish" trend, two downward waves or a break below the April 6 low are required.
There was no news background on Monday, either in the UK or in the US. Even from the Middle East, no reports were received, so the market is currently forced to rely only on various rumors and speculation, as well as to wait for central bank meetings that will take place on Wednesday and Thursday. In my opinion, traders are not reacting to any rumors surrounding negotiations between the US and Iran. There is also no direct evidence that negotiations between Iran and the US are actually taking place now. As for central bank meetings, none of the three is going to change monetary policy parameters in April. Regarding economic reports, traders continue to treat them rather coolly. This week, the market's attitude toward economic events may change, but traders may already have inflated expectations regarding the market's reaction to the information flow over the next four days. In practice, most of these events may be ignored.
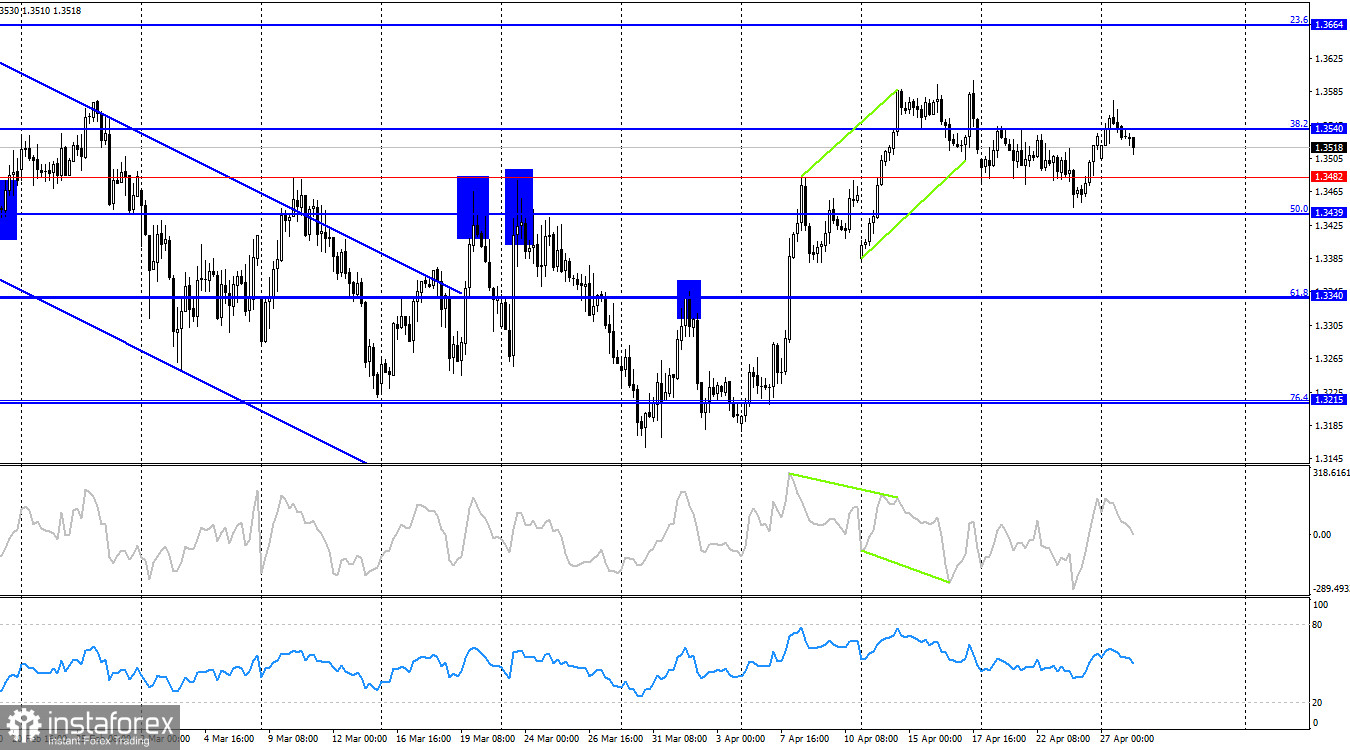
On the 4-hour chart, the pair has consolidated above the descending trend channel, which allows for expectations of a full-fledged "bullish" trend. A rebound from the Fibonacci level of 38.2% (1.3540) allows for some decline, but the graphical picture on the hourly chart is currently clearer, so I recommend relying on it. No new emerging divergences are observed today.
Commitments of Traders (COT) report:
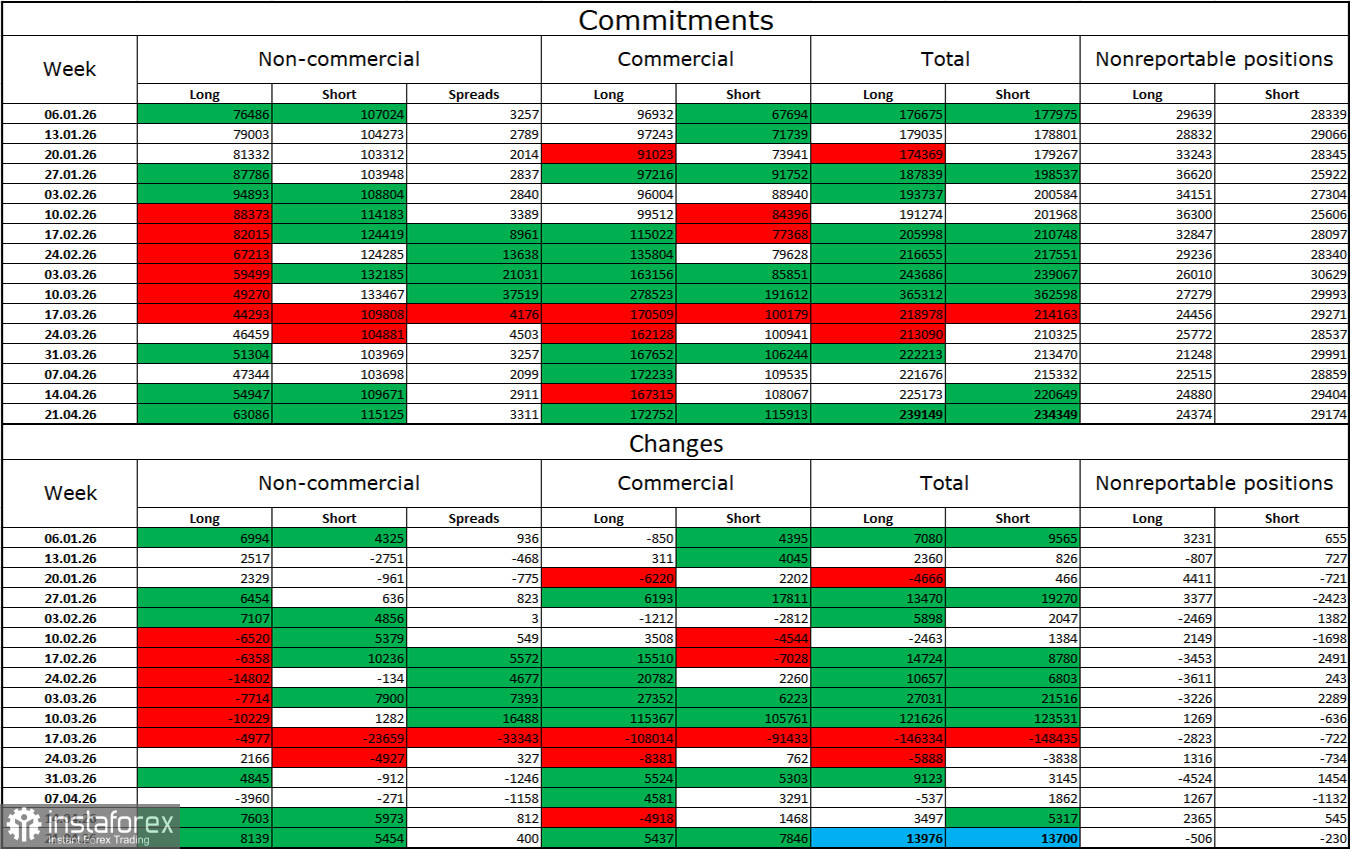
The sentiment of the "Non-commercial" category of traders became less "bearish" over the last reporting week. The number of long positions held by speculators increased by 8,139, while the number of short positions rose by 5,454. The gap between long and short positions is now effectively: 63 thousand versus 115 thousand. For six consecutive weeks, non-commercial traders actively increased selling and reduced buying, which led to a strong imbalance between long and short positions. In recent weeks, bears have dominated, which raises no questions given the geopolitical situation.
I still do not believe in a "bearish" trend for the pound, but now everything depends not on economic indicators, Trump's trade policy, or central banks' monetary policy, but on the duration, scale, and consequences of the war in the Middle East. In recent weeks, the market has shifted toward expectations of de-escalation of the conflict, but the latest news suggests that a full ceasefire is still far away, and the war could resume at any time. In this case, the advantage of the bears could become even stronger.
News calendar for the US and the UK:
On April 28, the economic calendar contains only one entry, which may also be ignored, just like most reports in recent weeks. The impact of the news background on market sentiment on Tuesday is likely to be absent again.
GBP/USD forecast and trading tips:
Selling the pair is possible today if it consolidates below the 1.3513–1.3539 level on the hourly chart, with a target of 1.3428–1.3437. Buying is possible on a rebound from the 1.3513–1.3539 level, with a target of 1.3596–1.3620.
Fibonacci retracement levels are drawn from 1.3866–1.3158 on the hourly chart and from 1.3012–1.3868 on the 4-hour chart.


