See also

 23.06.2026 03:52 AM
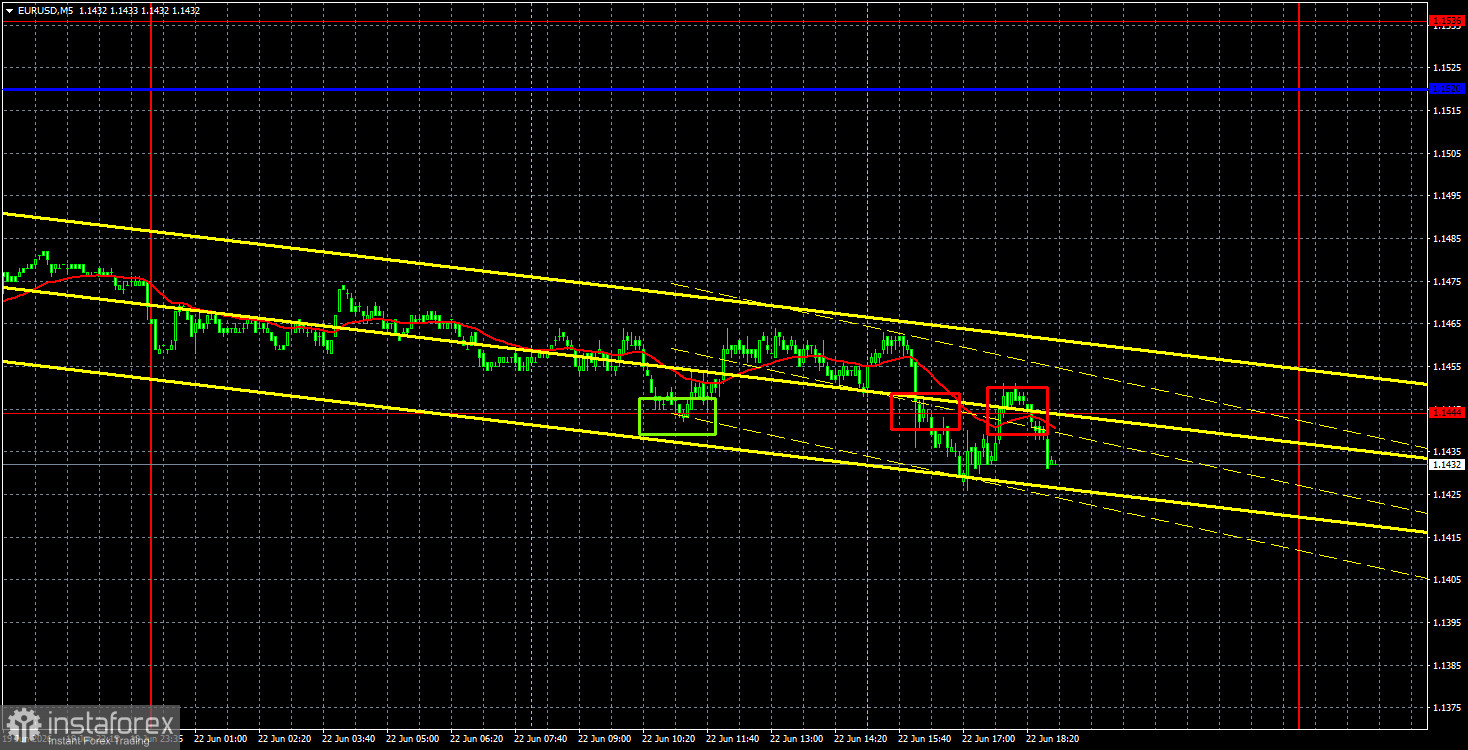
The EUR/USD currency pair attempted to continue its downward movement on Monday. The fall of the European currency began last Wednesday evening when the Federal Reserve announced its readiness to tighten monetary policy to reduce inflation. We still cannot say there was anything unexpected in this decision by the U.S. central bank, as before the June meeting, the market anticipated one rate cut by the end of the year. The meeting has passed, and the market is still waiting... for that rate cut. Perhaps Kevin Warsh's rhetoric was unexpectedly "hawkish," but we do not think that factor can support the dollar for four consecutive days. It's also hard to say that geopolitics is responsible for the U.S. dollar's renewed strength. The conflict in the Middle East has been resolved, and the Strait of Hormuz is currently closer to opening than it was a month ago. The U.S. has begun lifting sanctions and restrictions on Iran, which can also be considered a de-escalation. Thus, in theory, the dollar should now be falling...
In technical terms, the downward trend has resumed, but while the dollar's rise was justified last Wednesday, it hasn't been in the following days. Nevertheless, the trend is again downward, so until it concludes, short positions are prioritized. A new trend line cannot yet be formed, as there is no second clearly defined extreme.
On the 5-minute timeframe on Monday, three trading signals were formed, each of which left much to be desired. All of them are marked in the illustration above. Volatility was again quite weak, so the trades did not yield the desired profit. We cannot call the dollar's strength logical.
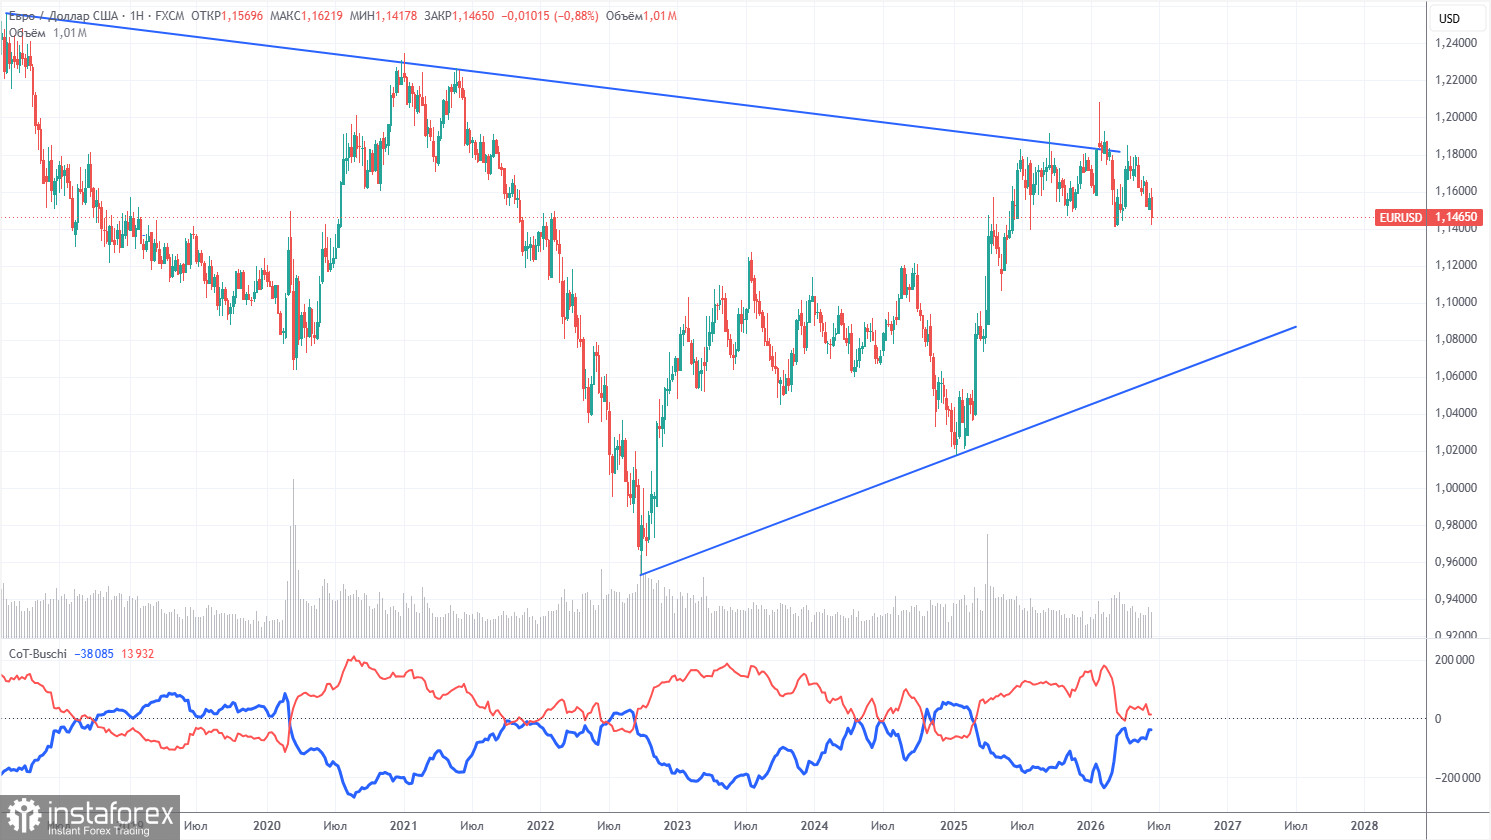
The latest COT report is dated June 9. The weekly timeframe illustration clearly shows that the net position of non-commercial traders remains "bullish" but has significantly decreased due to geopolitical events. Traders have been offloading the European currency in favor of the U.S. dollar in recent months. Trump's policies have not changed, but the dollar has served as a "reserve currency" for some time. However, this process may already be coming to an end.
We still do not see any fundamental factors supporting the strength of the European currency, but there are plenty of factors supporting the fall of the American dollar. The war in the Middle East made the dollar temporarily super attractive, but when this factor expires, everything will revert to its previous state. That expiration could already have occurred. In the long term, the euro could fall to the level of $1.08 (the trend line), but the upward trend will still remain relevant. Over the past few months, the pair has not come particularly close to this line.
The positioning of the red and blue lines of the indicator indicates parity between bulls and bears. Over the last reporting week, the number of longs in the "Non-commercial" group decreased by 15,900, while the number of shorts increased by 19,000. Consequently, the net position decreased by 34,900 contracts over the week.
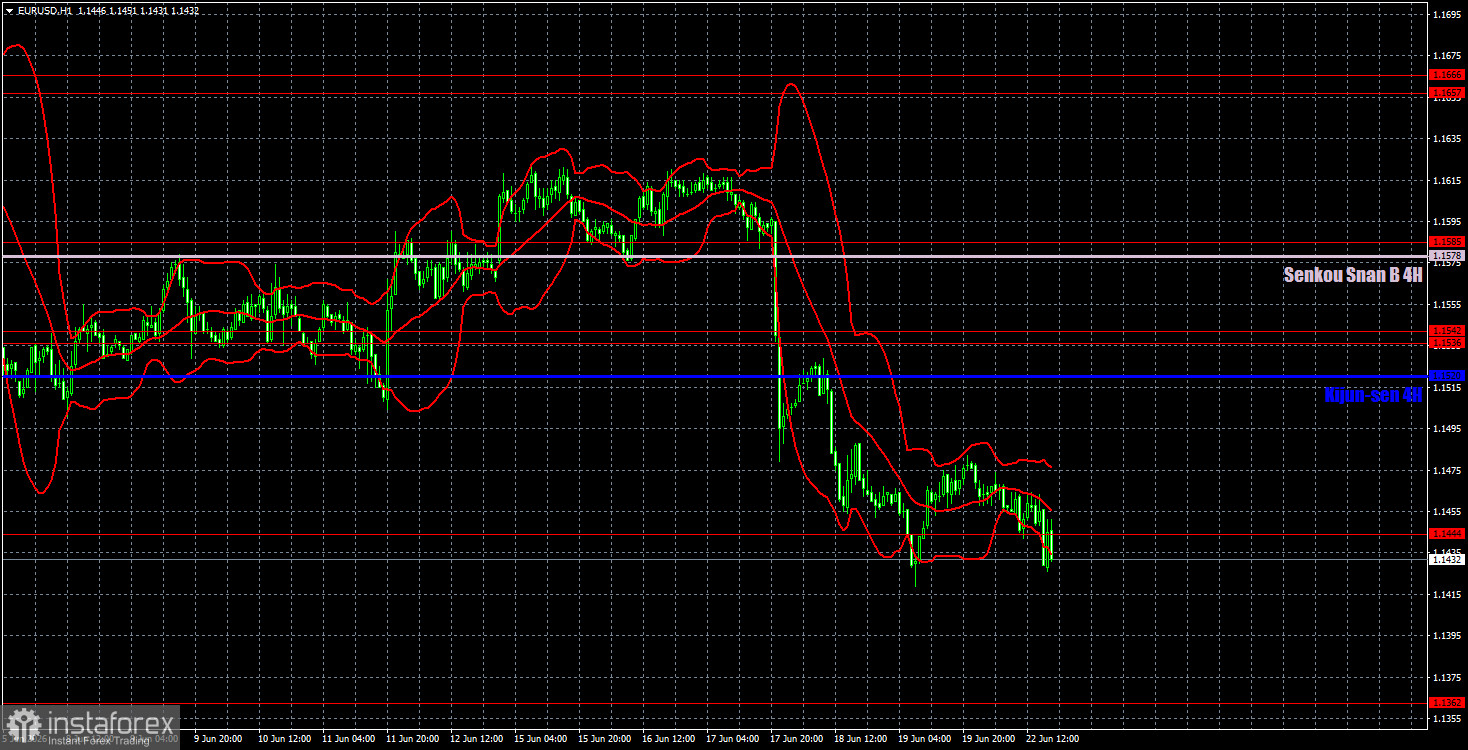
On the hourly timeframe, the upward trend has been canceled, and the continuation of the downward trend is in question. The situation in the Middle East has been resolved, so the dollar can no longer expect support from geopolitics. The Fed provided strong support for the U.S. dollar on Wednesday, but it is difficult to explain why the decline continues to this day. The market continues to buy dollars without reason and also ignores factors in favor of the euro.
For June 23, we identify the following levels for trading: 1.1362, 1.1444, 1.1536-1.1542, 1.1585, 1.1657-1.1666, 1.1750-1.1760, 1.1786, 1.1830-1.1837, 1.1907-1.1922, as well as the Ichimoku Senkou Span B line (1.1578) and the Kijun-sen line (1.1520). The lines of the Ichimoku indicator may shift during the day, which should be taken into account when determining trading signals. Don't forget to set Stop Loss orders to breakeven if the price moves 15 pips in the correct direction. This will protect against potential losses if the signal proves false.
On Tuesday, indices of business activity in the services and manufacturing sectors for June will be published in the EU, Germany, and the U.S. The market is unlikely to react significantly to these reports, as it continues to largely ignore the macroeconomic backdrop. The dollar's inertial rise could continue even without substantial reasons.
Today, traders may stay in short positions targeting 1.1362, as the price has surpassed the level of 1.1444. Long positions can be opened with a target of 1.1536-1.1542 if the pair consolidates above 1.1444.
Price levels of support and resistance (resistance/support) – thick red lines around which movements may end. They are not sources of trading signals.
Kijun-sen and Senkou Span B lines – Ichimoku indicator lines transferred to the hourly timeframe from the 4-hour timeframe. They are strong lines.
Extreme levels – thin red lines from which the price has previously bounced. They are sources of trading signals.
Yellow lines – trend lines, trend channels, and any other technical patterns.
Indicator 1 on COT charts – the size of the net position for each category of traders.


