
See also


 13.07.2026 09:54 AM
On the hourly chart, the GBP/USD pair reversed in favor of the U.S. dollar on Friday and declined toward the 76.4% Fibonacci retracement level at 1.3382. A rebound from this level would favor the British pound and support a resumption of growth toward the 1.3454–1.3457 resistance level, which has already been nearly tested. Consolidation below 1.3382 would signal further downside toward 1.3335 and 1.3298.
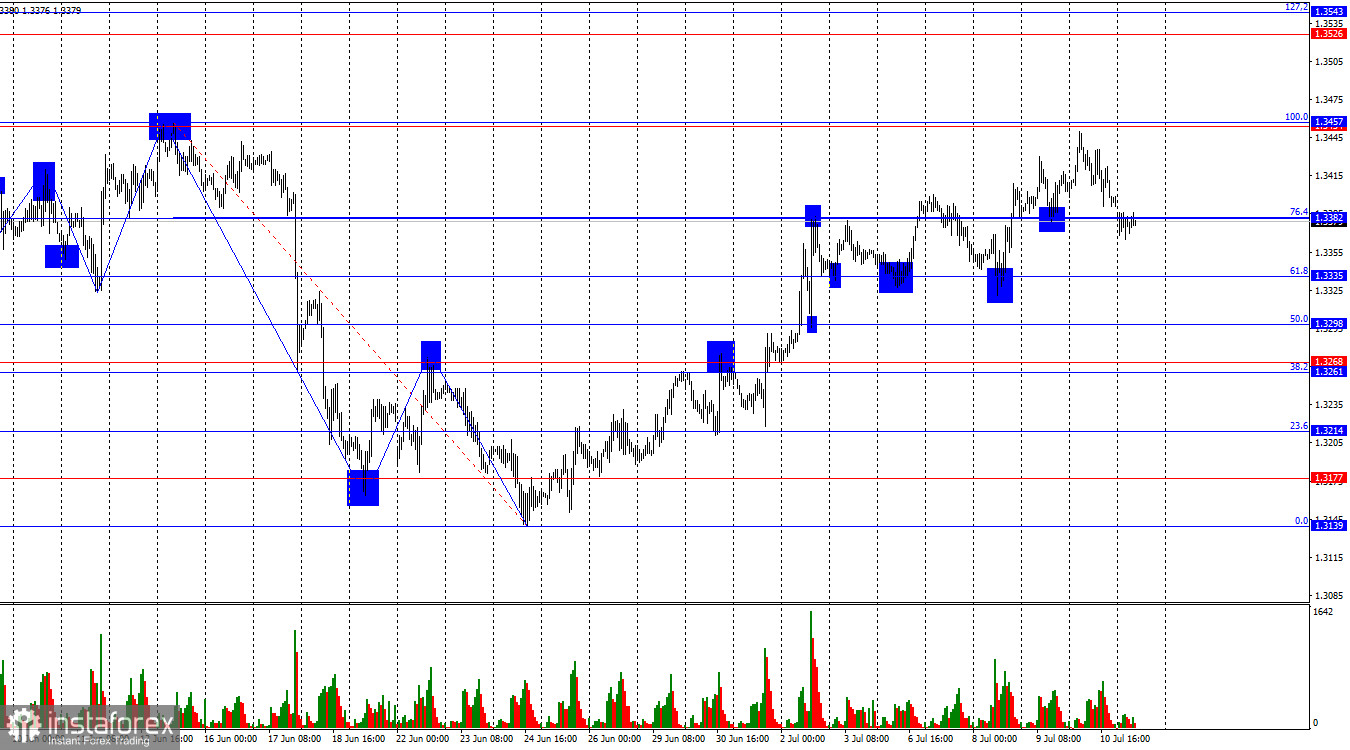
The wave structure remains bullish. The latest completed downward wave broke below the previous low, while the new upward wave has exceeded the previous high and continues to develop. Thus, the bulls remain in control, although I had expected this scenario to unfold about two to three weeks earlier. Better late than never. In my view, the bearish impulse that dominated in 2026 has been completed, and only geopolitical developments are capable of disrupting the bullish scenario.
There was virtually no significant macroeconomic news on Friday. Ideally, that would have remained the case, but on Saturday Iran reportedly attacked another tanker in the Strait of Hormuz, while the United States carried out strikes against Iran, prompting an immediate retaliatory response. As a result, we witnessed another escalation in the Middle East. At this stage, it remains unclear which direction both sides of the conflict intend to take. Judging by recent actions, they appear to be moving toward a new military confrontation. Judging by official statements, however, they continue to speak about peace. I prefer to focus on actions rather than rhetoric, so I believe the negotiations are effectively on hold, whereas the military confrontation is not. If talks are not resumed soon, the bears may once again regain the upper hand. Such swings in market sentiment could continue until Iran and the United States reach a clear and mutually acceptable resolution. For today, I recommend relying primarily on technical analysis. Tomorrow, however, the U.S. inflation report will be released and should provide important clues regarding the Federal Reserve's future monetary policy strategy.
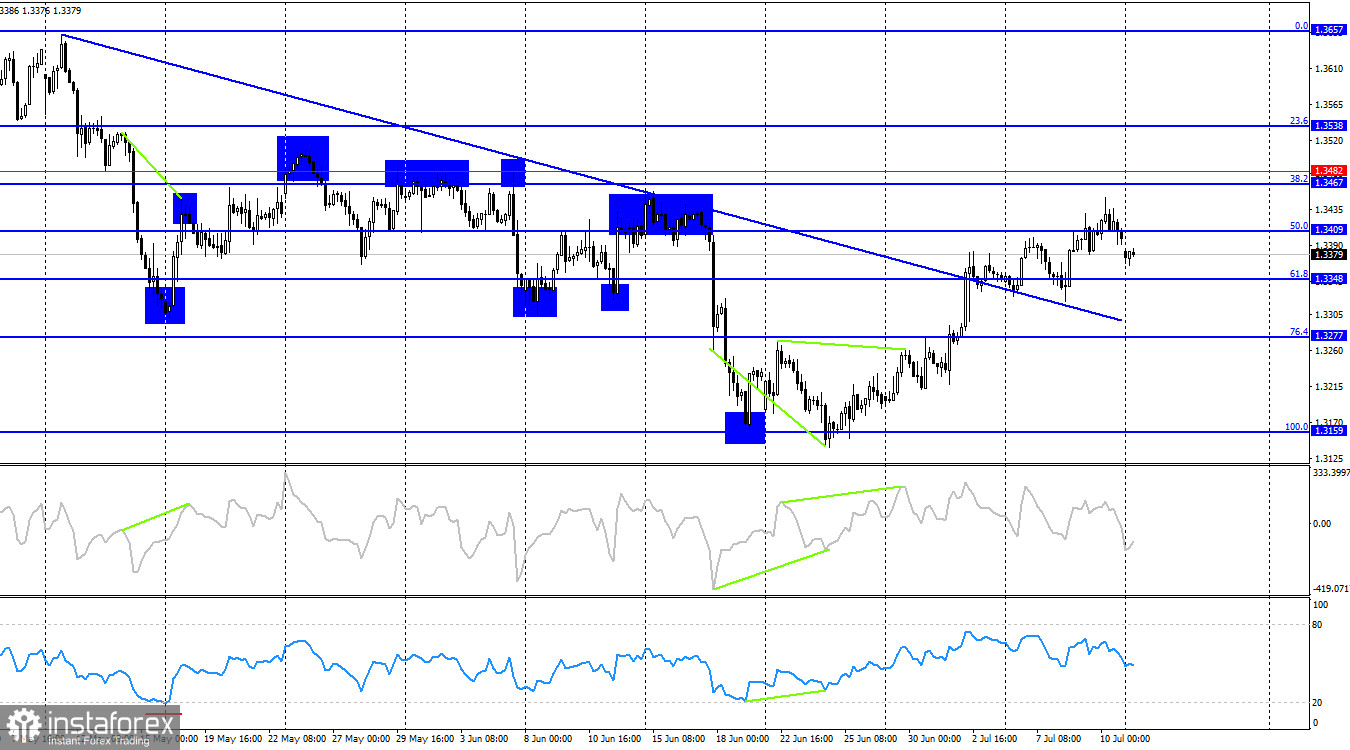
On the four-hour chart, GBP/USD rebounded from the 100.0% Fibonacci retracement level at 1.3159, reversed in favor of the British pound, and advanced toward the 50.0% Fibonacci level at 1.3409. Therefore, traders may continue to target the next Fibonacci level at 38.2% (1.3467). However, market activity remains relatively subdued, making the hourly chart the more reliable reference for trading decisions. The CCI indicator may also form a bullish divergence in the near future.
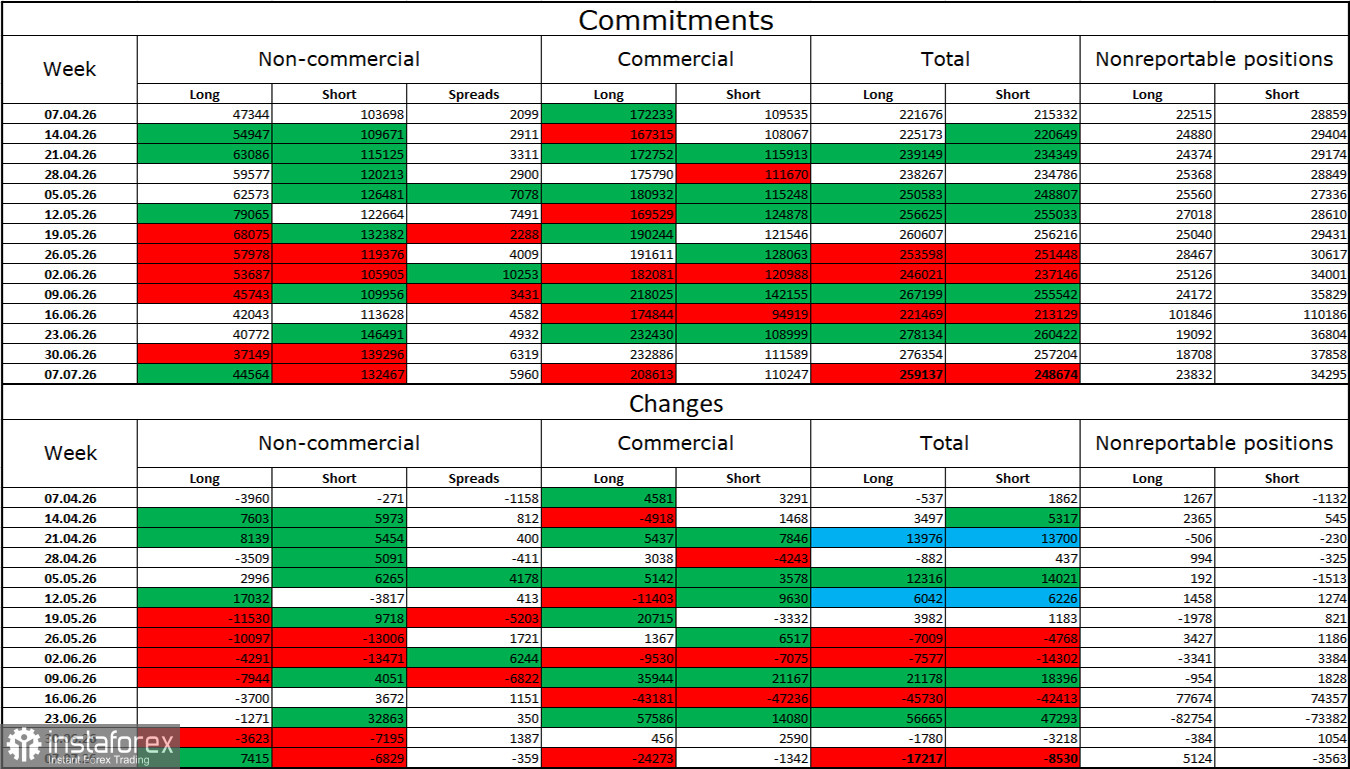
Sentiment among the Non-commercial group became less bearish during the latest reporting week, although it still remains bearish overall. The number of Long positions held by speculative traders increased by 7,415, while Short positions declined by 6,829. The current positioning gap stands at approximately 45,000 Long positions versus 132,000 Short positions. Bears have dominated the market for several months. Previously, this dominance was fully justified, but the information backdrop has changed significantly, making the current imbalance less convincing. Even so, bearish positions still outnumber bullish ones by nearly three to one.
I still do not believe in a sustained bearish trend for the British pound. In the near term, however, market direction will depend less on economic data, Trump's trade policy, or central bank monetary policy than on the duration, scale, and consequences of the conflict in the Middle East. Over recent weeks, market participants have increasingly priced in a peaceful outcome, but negotiations between Iran and the United States could prove lengthy and difficult. Moreover, there is no guarantee that they will ultimately result in a nuclear agreement.
The economic calendar for July 13 contains no significant events. As a result, macroeconomic data is unlikely to influence market sentiment on Monday.
Sell positions may be considered if the pair closes below 1.3382 on the hourly chart, with downward targets at 1.3335 and 1.3298. Buy positions may be considered following a rebound from 1.3382, targeting the 1.3454–1.3457 resistance level.
Fibonacci retracement grids are plotted from 1.3457 to 1.3139 on the hourly chart and from 1.3158 to 1.3655 on the four-hour chart.


