
See also


 18.08.2026 09:52 AM
On the hourly chart, the GBP/USD pair made a second rebound from the 100.0% corrective level at 1.3556 on Monday, reversed in favor of the US dollar, and began moving lower toward the 76.4% Fibonacci level at 1.3489. A rebound of the quotes from the 1.3526 or 1.3489 levels would allow traders to expect renewed growth toward 1.3556. Consolidation below the 1.3489 level would increase the likelihood of further declines in the pound toward the next corrective level of 61.8% at 1.3447.
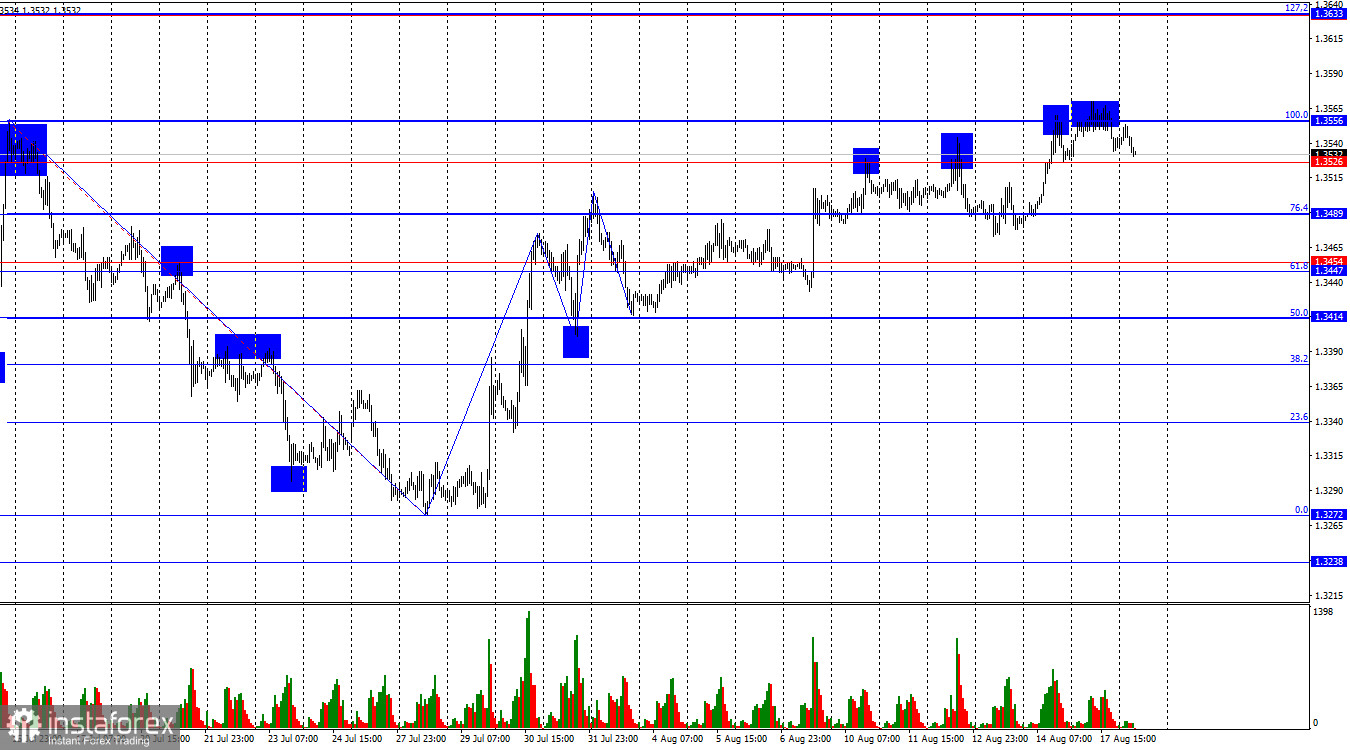
The situation has shifted to a "bullish" one, but only due to a significant reduction in the size of the identifiable waves. The latest completed downward wave failed to break below the previous low, while the latest upward wave (not yet complete) broke above the previous peak. Thus, the bulls currently hold the initiative in the market, but their advantage is not entirely convincing. Three consecutive unsuccessful attempts to break through the 1.3526–1.3557 level could allow the bears to take the initiative.
The fundamental backdrop was virtually absent on Monday, and trader activity was extremely low. However, economic data releases from the UK began early on Tuesday morning. Most of the important UK statistics are usually released within a single week. Therefore, over the next few days, traders may get a fairly complete picture of the current state of the British economy. The unemployment rate was released this morning and, contrary to forecasts, remained at 4.9%. Tomorrow, the inflation report will be released, which carries even greater importance. The unemployment report triggered a retreat by the bulls, as traders had expected this indicator to decline in June. It should also be noted that average earnings increased by 4.1%, in line with forecasts, while the number of unemployment benefit claims fell by 11 thousand against expectations of a rise of 11 thousand. However, the unemployment rate is the most important report, so traders reacted primarily to this figure. This explains the pound's decline this morning.
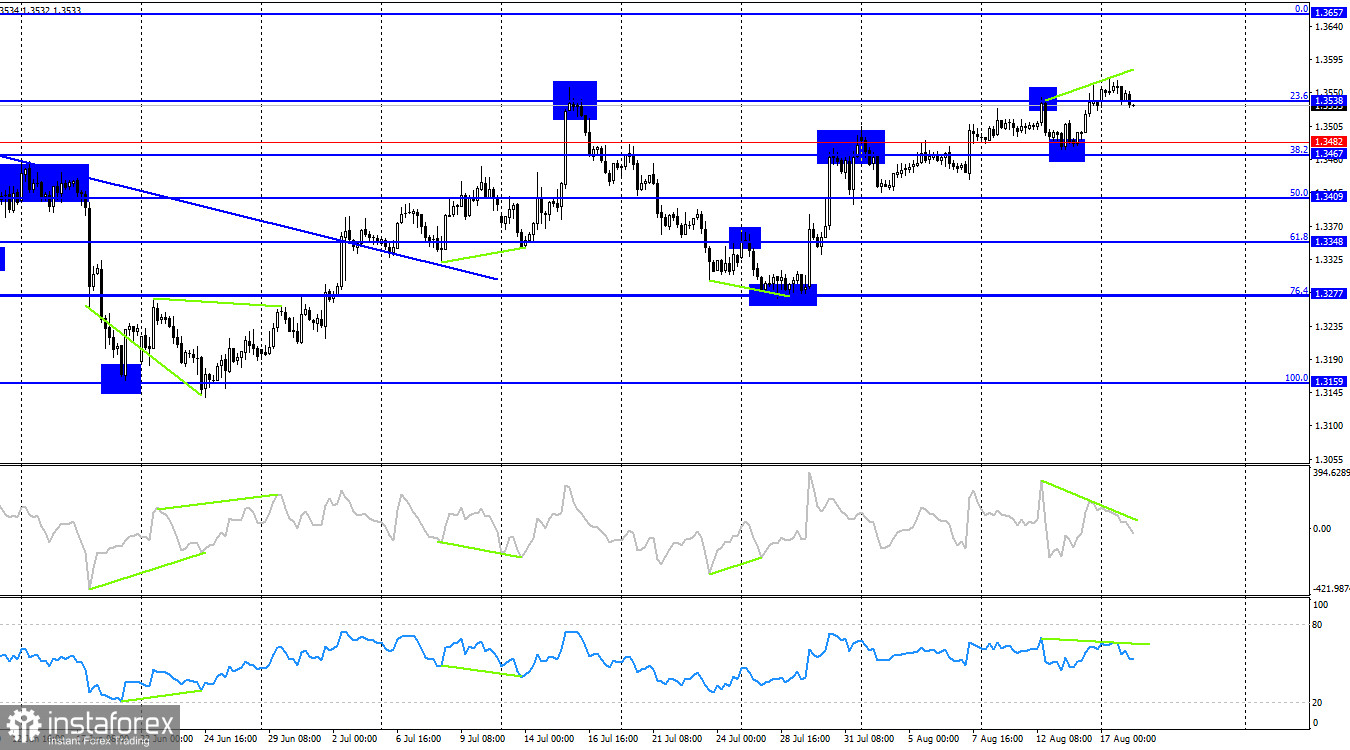
On the 4-hour chart, the GBP/USD pair rebounded from the 1.3467–1.3482 support level, reversed in favor of the pound, and consolidated above the 23.6% corrective level at 1.3538. Therefore, on the 4-hour chart, the pound also has grounds to continue rising toward the next Fibonacci level of 0.0% at 1.3657. However, consolidation below the 1.3538 level would allow the bears to launch an attack. A "bearish" divergence on the CCI and RSI indicators also suggests the possibility of a further decline in the pound.
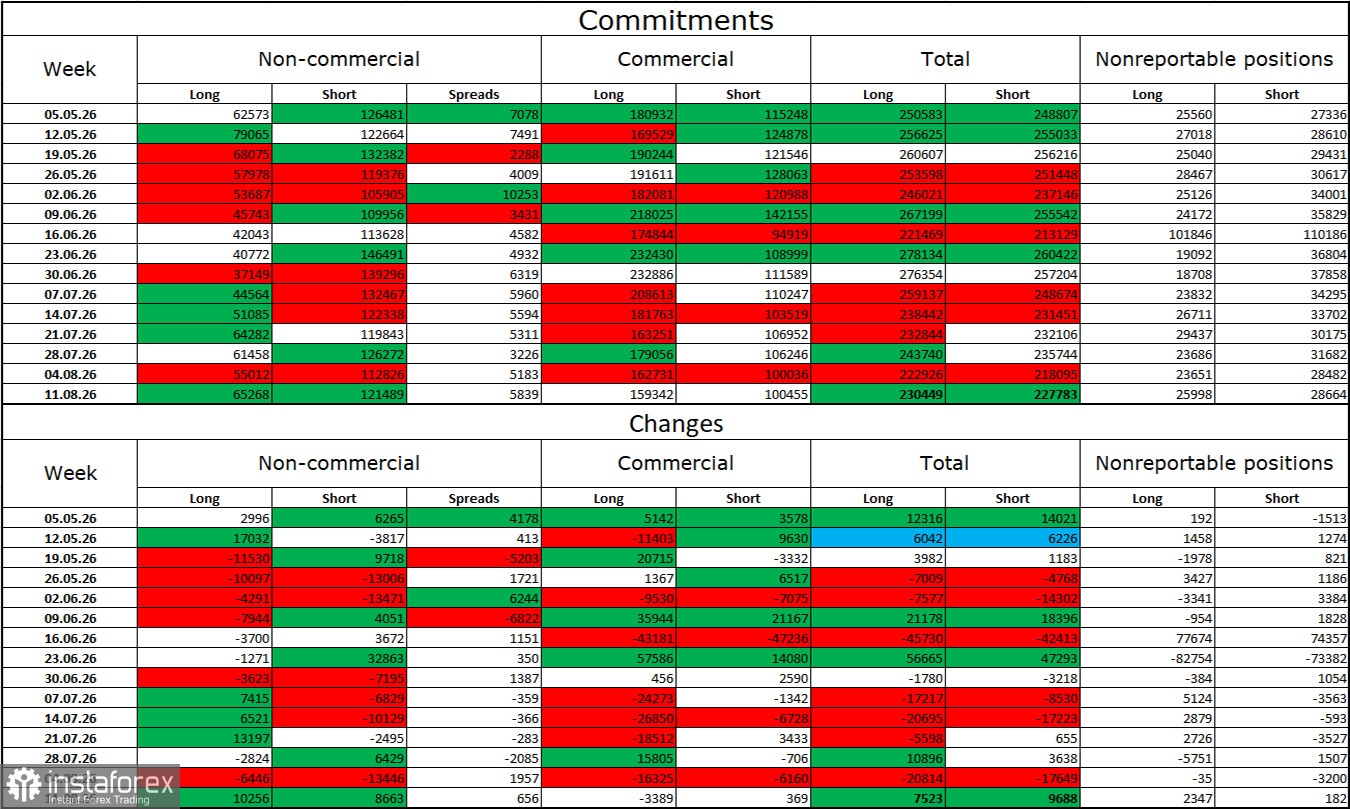
The sentiment of the "Non-commercial" trader category became slightly less "bearish" during the latest reporting week. The number of Long positions held by speculators increased by 10,256, while the number of Short positions rose by 8,663. The current gap between Long and Short positions is approximately 65 thousand versus 121 thousand. The gap and the bears' advantage are gradually narrowing, but the bears still maintain a significant advantage. Previously, bearish dominance was unquestionable, but now it is being challenged, as the fundamental backdrop has changed.
I still do not believe in a "bearish" trend for the pound, but in the near future, everything will depend not on economic indicators, Trump's trade policy, or central bank monetary policy, but on the duration, scale, and consequences of the war in the Middle East. In recent months, the market has shifted its focus toward a potential peace scenario, but negotiations between Iran and the United States failed before they had even properly begun. There is no guarantee that they will resume in the near future.
The economic calendar for August 18 contains seven reports, and the UK releases stand out among them. The impact of the economic backdrop on market sentiment on Tuesday will remain present throughout the day.
Selling opportunities appeared after a rebound from the 1.3556 level on the hourly chart, with a target of 1.3489. These trades can still be kept open today. Buying opportunities may arise today after a rebound from the 1.3526 or 1.3489 levels, with a target of 1.3556.
The Fibonacci grids are drawn from 1.3557 to 1.3272 on the hourly chart and from 1.3158 to 1.3655 on the 4-hour chart.


