Bullish Rectangle
was formed on 29.04 at 02:15:19 (UTC+0)
signal strength 2 of 5
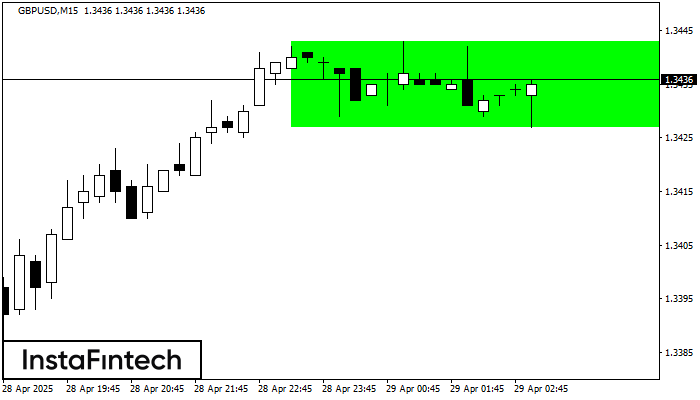
According to the chart of M15, GBPUSD formed the Bullish Rectangle which is a pattern of a trend continuation. The pattern is contained within the following borders: the lower border 1.3427 – 1.3427 and upper border 1.3443 – 1.3443. In case the upper border is broken, the instrument is likely to follow the upward trend.
The M5 and M15 time frames may have more false entry points.
See Also
- All
- All
- Bearish Rectangle
- Bearish Symmetrical Triangle
- Bullish Rectangle
- Double Top
- Double Top
- Triple Bottom
- Triple Bottom
- Triple Top
- Triple Top
- All
- All
- Buy
- Sale
- All
- 1
- 2
- 3
- 4
- 5
বিয়ারিশ ফ্ল্যাগ
was formed on 29.08 at 14:31:11 (UTC+0)
signal strength 3 of 5
M30 চার্টে GBPJPY-এর বিয়ারিশ ফ্ল্যাগ প্যাটার্ন গঠিত হয়েছে। এই প্যাটার্নের নীচের সীমানা 197.86/198.12 -এ অবস্থিত এবং উপরের সীমানা 198.12/198.38-এ অবস্থিত। ফ্ল্যাগপোলের প্রজেকশন হল 71 পয়েন্ট। এই গঠনটি এই ইঙ্গিত দেয়
Open chart in a new window
বিয়ারিশ পেন্যান্ট
was formed on 29.08 at 14:31:07 (UTC+0)
signal strength 3 of 5
M30 চার্টে GBPJPY-এর বিয়ারিশ পেন্যান্ট প্যাটার্ন গঠিত হয়েছে৷ এই প্যাটার্নের ধরনটি সামান্য মন্থরতা দ্বারা চিহ্নিত করা হয় যার পরে মূল্য মূল প্রবণতার দিকে চলে যাবে। প্যাটার্নের সর্বনিম্ন 197.86 এর নীচে
Open chart in a new window
ডাবল বটম
was formed on 29.08 at 14:29:58 (UTC+0)
signal strength 3 of 5
M30 চার্টে, AUDCAD-এর ডাবল বটম প্যাটার্নটি গঠিত হয়েছে। এই প্যাটার্নের গঠন এই সংকেত প্রদান করে যে মূল্য বিপরীতমুখী হয়ে নিম্নমুখী থেকে ঊর্ধ্বমুখী প্রবণতা প্রদর্শন করবে। এই প্যাটার্নের উপরের সীমানা 0.8991
Open chart in a new window