Double Bottom
was formed on 29.04 at 12:30:05 (UTC+0)
signal strength 3 of 5
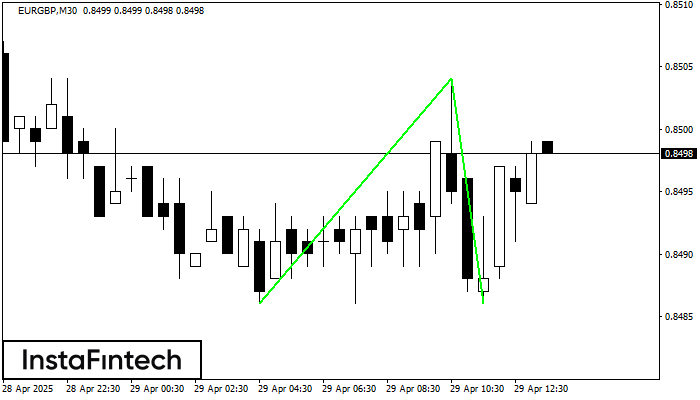
The Double Bottom pattern has been formed on EURGBP M30; the upper boundary is 0.8504; the lower boundary is 0.8486. The width of the pattern is 18 points. In case of a break of the upper boundary 0.8504, a change in the trend can be predicted where the width of the pattern will coincide with the distance to a possible take profit level.
See Also
- All
- All
- Bearish Rectangle
- Bearish Symmetrical Triangle
- Bullish Rectangle
- Double Top
- Double Top
- Triple Bottom
- Triple Bottom
- Triple Top
- Triple Top
- All
- All
- Buy
- Sale
- All
- 1
- 2
- 3
- 4
- 5
Persegi Bearish
was formed on 28.07 at 03:51:32 (UTC+0)
signal strength 3 of 5
Menurut grafik dari M30, NZDCHF terbentuk Persegi Bearish yang merupakan pola dari kelanjutan tren. Pola terkandung di dalam batas berikut: batas lebih rendah 0.4776 – 0.4776 dan batas atas 0.4790
Open chart in a new window
Persegi Bullish
was formed on 23.07 at 20:33:19 (UTC+0)
signal strength 3 of 5
Menurut grafik dari M30, #TSLA terbentuk Persegi Bullish yang merupakan pola dari kelanjutan tren. Pola terkandung dalam batas berikut: batas yang lebih rendah 328.44 – 328.44 dan batas atas 335.91
Open chart in a new window
Persegi Bullish
was formed on 04.07 at 22:12:11 (UTC+0)
signal strength 3 of 5
Menurut grafik dari M30, EURCAD terbentuk Persegi Bullish yang merupakan pola dari kelanjutan tren. Pola terkandung dalam batas berikut: batas yang lebih rendah 1.6017 – 1.6017 dan batas atas 1.6038
Open chart in a new window