

Pola sebenarnya

Bullish Rectangle
was formed on 30.04 at 21:12:27 (UTC+0)
signal strength 4 of 5
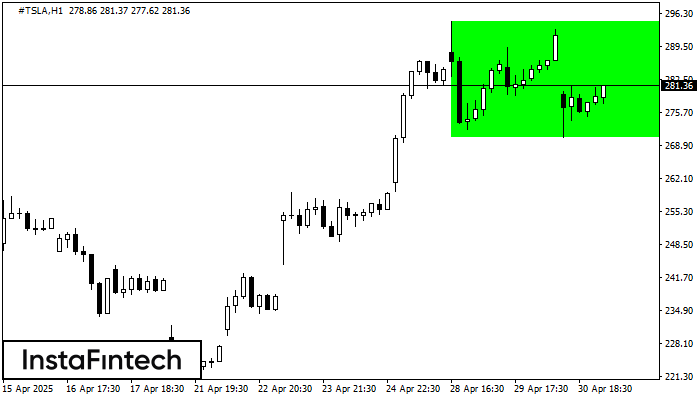
According to the chart of H1, #TSLA formed the Bullish Rectangle. The pattern indicates a trend continuation. The upper border is 294.59, the lower border is 270.55. The signal means that a long position should be opened above the upper border 294.59 of the Bullish Rectangle.
Figure
Instrument
Timeframe
Trend
Signal Strength


