यह भी देखें

 19.09.2023 09:29 AM
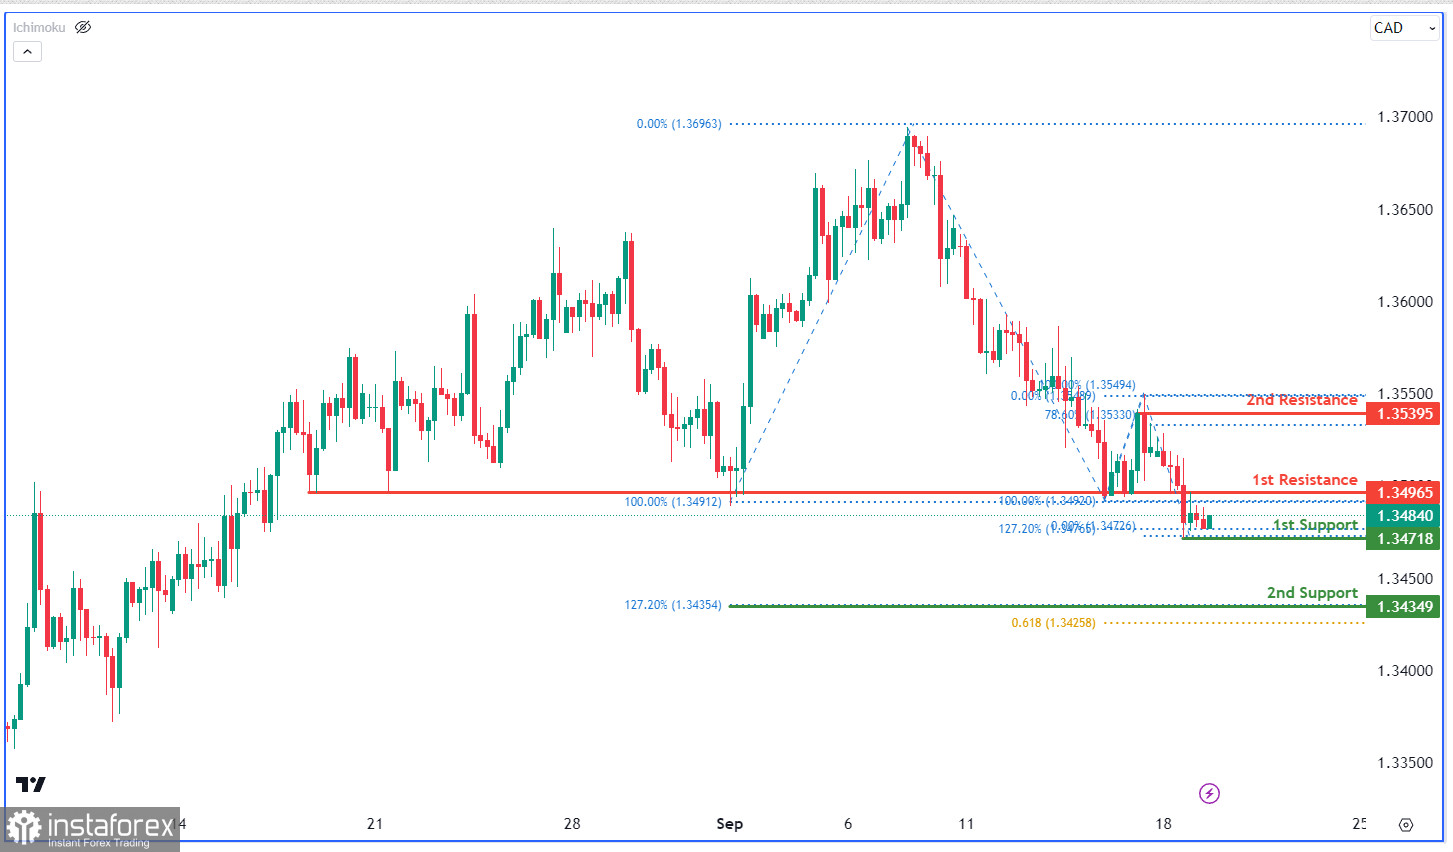
The USD/CAD chart displays a neutral trend, suggesting price may range between the 1st support and resistance. The 1st support at 1.3472 aligns with the 127.20% Fibonacci extension, while the 2nd support at 1.3435 coincides with multiple Fibonacci levels. On the upside, resistances are at 1.3497 (pullback resistance) and 1.3539, which is a swing-high resistance matched with the 78.60% Fibonacci retracement.
You have already liked this post today
*यहां पर लिखा गया बाजार विश्लेषण आपकी जागरूकता बढ़ाने के लिए किया है, लेकिन व्यापार करने के लिए निर्देश देने के लिए नहीं |

