यह भी देखें

 26.10.2023 06:13 AM
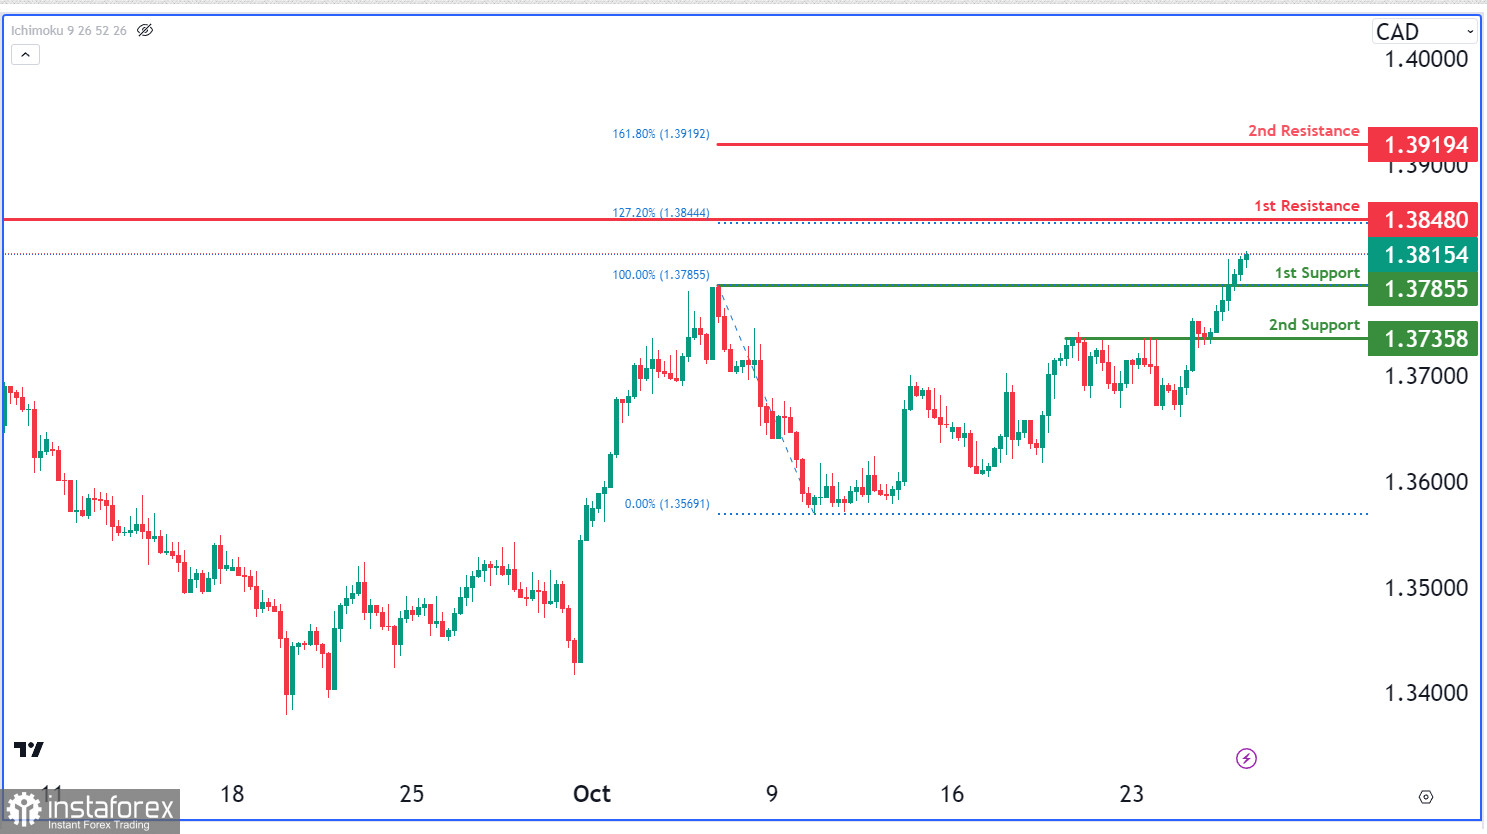
The USD/CAD chart currently displays bullish overall momentum, with the potential scenario of a bullish continuation towards the 1st resistance level.
The 1st resistance level at 1.3848 is identified as a swing-high resistance that aligns with the 127.20% Fibonacci extension level. Higher up, the 2nd resistance level at 1.3919 is marked as a resistance level that aligns with the 161.80% Fibonacci extension level.
To the downside, the 1st support level at 1.3786 is identified as a pullback support. Further below, the 2nd support level at 1.3736 is noted as an overlap support, potentially acting as a strong support zone.
You have already liked this post today
*यहां पर लिखा गया बाजार विश्लेषण आपकी जागरूकता बढ़ाने के लिए किया है, लेकिन व्यापार करने के लिए निर्देश देने के लिए नहीं |

