यह भी देखें

 05.02.2026 09:52 AM
Glass half empty or half full? Judging by the Nasdaq Composite's worst daily performance since April, the US equity market is under pressure. Yet 92 S&P 500 constituents hit fresh record highs on February 4, marking the best performance count since November 2024. Seven of 11 sectors closed in the green, as did the market-cap-weighted broad index. Optimists have not yet disappeared from the United States.
Dynamics of top-performing companies
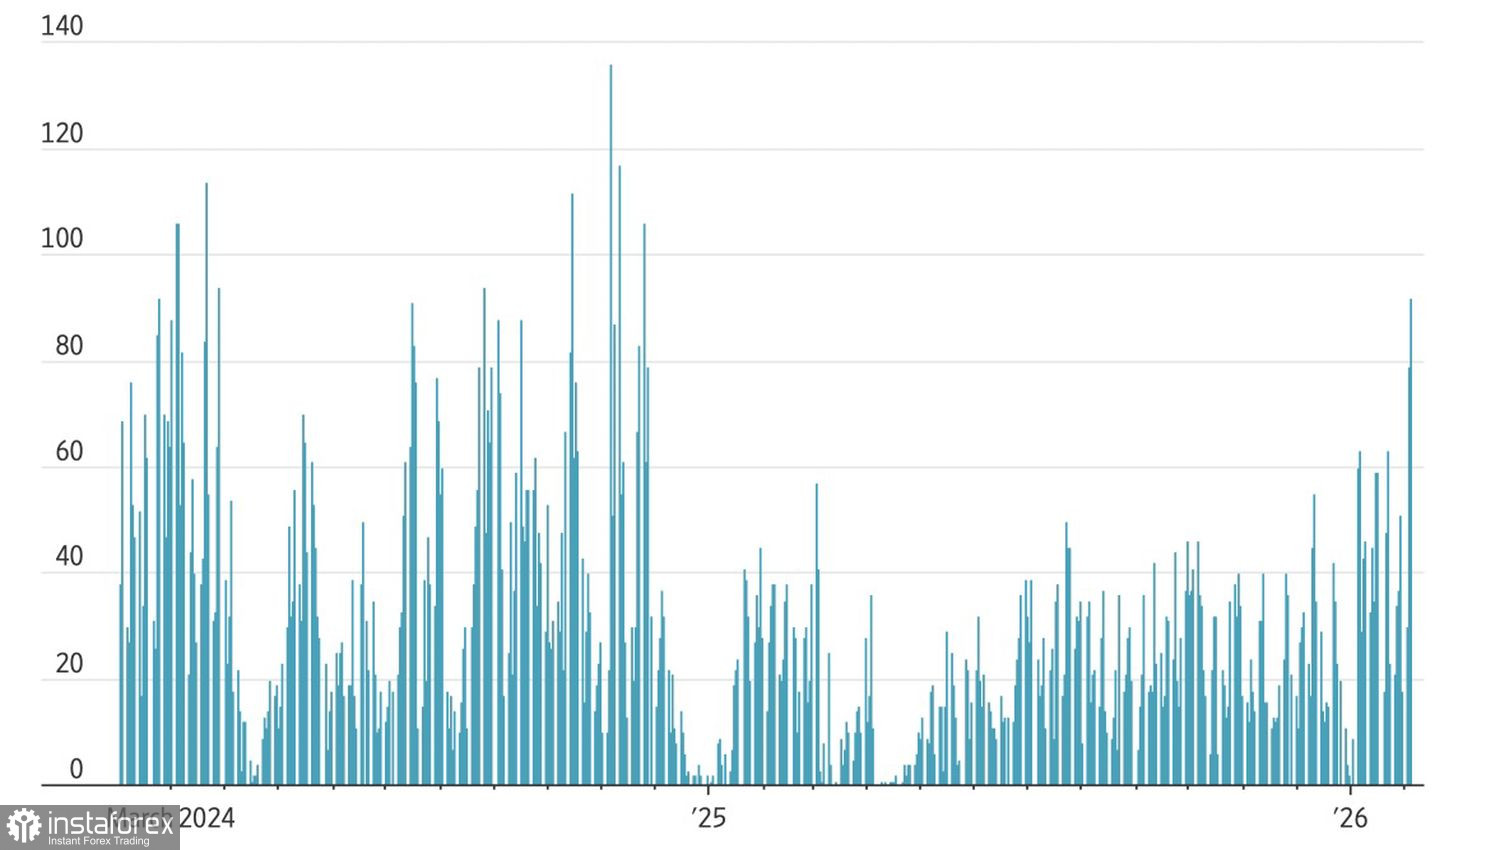
Investors argue endlessly about a bubble. Some call it the biggest ever; others say the ingredients are not all there. The two-day decline in the S&P 500 is not so much a broad liquidation as an acceleration of rotation. Of the 92 new highs, 27 came from industrial companies, 15 from financial companies, and 10 from energy companies.
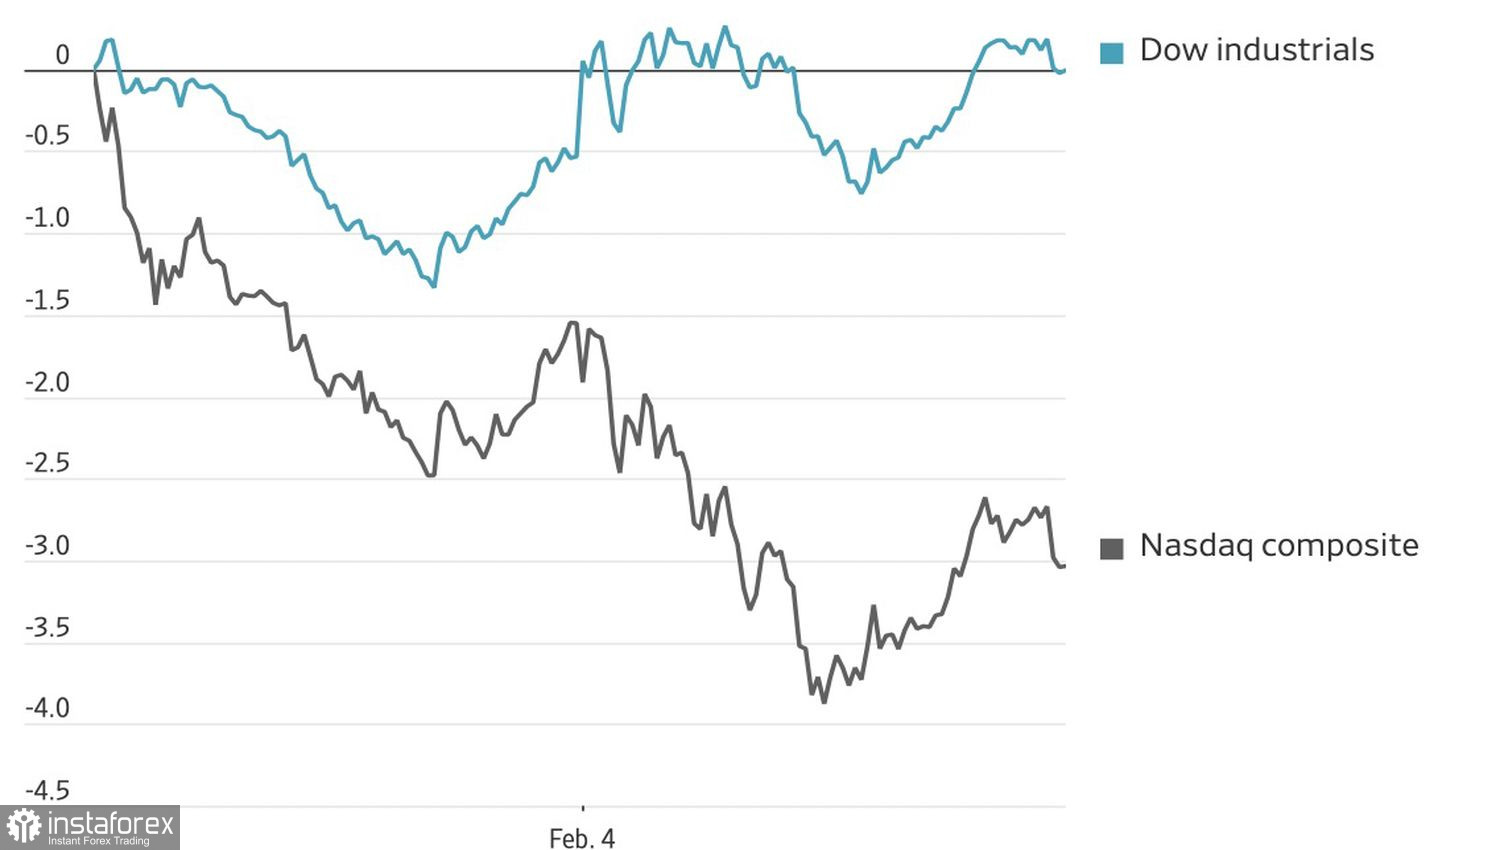
Laggards included not only software producers but even some tech giants. Meta Platforms shares are down almost 7% year-to-date, and NVIDIA nearly 9%. What do they have to do with Anthropic's new product? In practice, these names are being sold to offset losses elsewhere. As a result, the Dow Jones outperformed the Nasdaq Composite.
Dynamics of US equity indices
At first glance, the software sell-off looks paradoxical: innovations that should help developers risk upending their business models and driving bankruptcies. But the market prefers to act preemptively. Investors are asking which issuers AI might displace next — law firms? Accounting firms? What should be sold first?
Markets are operating in an environment where the tech sector is guilty until proven innocent — effectively accused ahead of trial. Given stretched fundamentals and lofty earnings expectations, growth is hard for the sector without spectacular corporate results.
Another hallmark of today's market is faster trading. When Big Tech is being traded, one must be able to enter and exit quickly; the "buy and hold" strategy belongs to the past. This dynamic shifts the S&P 500 from trend trading toward range trading.
Pressure on the broad index was amplified by hawkish rhetoric from FOMC officials and disappointing ADP private sector employment data. Conversely, an ISM services surprise — stronger-than-expected growth in services activity — catalysed rotation into industrials and supported stocks in that sector.
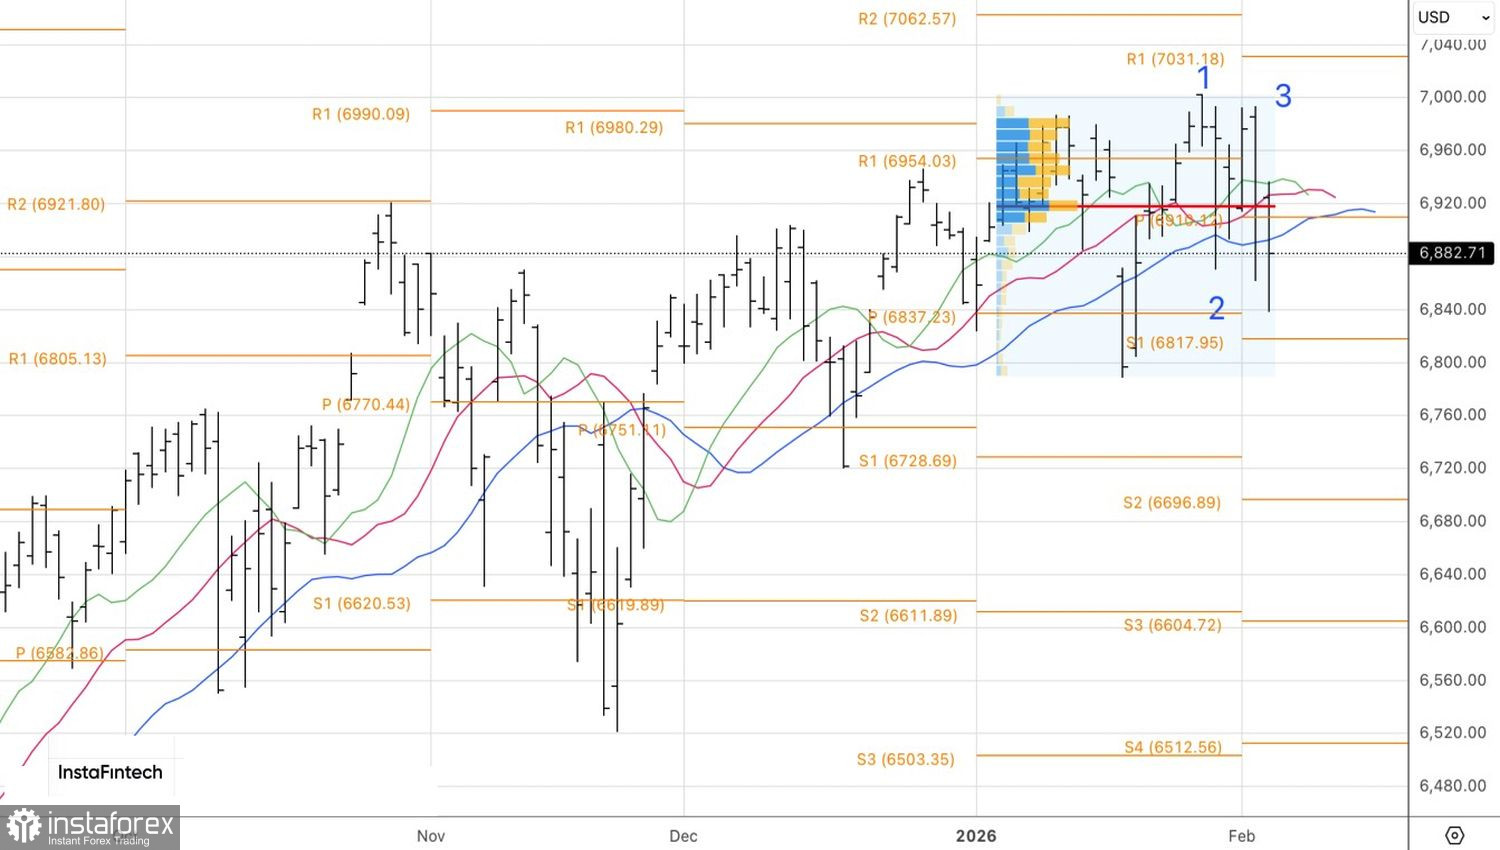
Technically, the daily S&P 500 chart shows that bears are attempting to complete a 1-2-3 reversal pattern. Ultimately, the index's fate hinges on who holds fair value at 6,920. A rise and consolidation above that level would reopen the case for adding long positions.

