
यह भी देखें


 17.08.2026 04:39 AM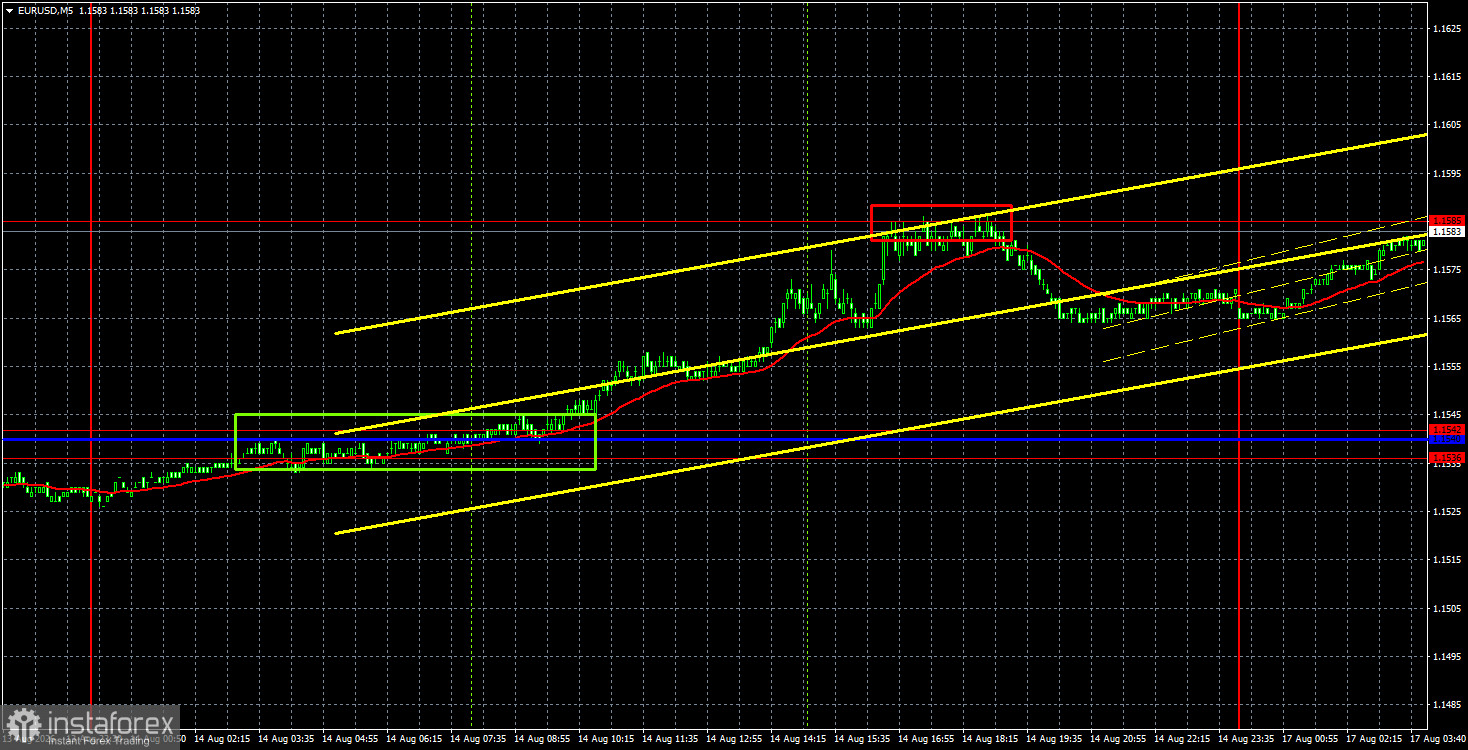
The EUR/USD currency pair resumed its upward movement on Friday, August 14. Throughout the day, the US dollar lost approximately 50-60 pips and continued to slide down slowly. There is room for growth for the European currency, as shown by the daily timeframe. In the first half of 2026, the US dollar appreciated against the euro from 1.2070 to 1.1350, and it is currently much closer to the cycle's low than to its high. Therefore, we reasonably anticipate that by the end of the current year, the pair will return to 1.2070. Earlier this year, we forecast that the euro would continue to grow. Geopolitics in the Middle East has clouded forecasts, but it can now be said that this factor no longer supports the dollar. Moreover, there are no other support factors for the dollar at this time. All the most important US reports have shown values that do not support the dollar. On Friday, both reports—retail sales and the University of Michigan consumer sentiment index—showed weaker-than-expected values, thus supporting the decline in the American currency.
From a technical standpoint, the pair has left the sideways channel at 1.1362-1.1461 after a month of "walking through torment" and is now in an upward trend. The euro remains close to its local highs, but growth over the past two weeks has practically stalled. However, the dollar cannot fall every day; this is a much slower process. Overcoming the 1.1585 level will open the euro's path to 1.1657.
On the 5-minute timeframe, two trading signals were generated on Friday. In the morning, the price overcame the 1.1536-1.1542 area, allowing long positions to be opened. During the American trading session, the level of 1.1585 was reached, at which the price ultimately bounced back. Therefore, long positions should have been closed, and it was even possible to open short positions. Both trades were profitable.
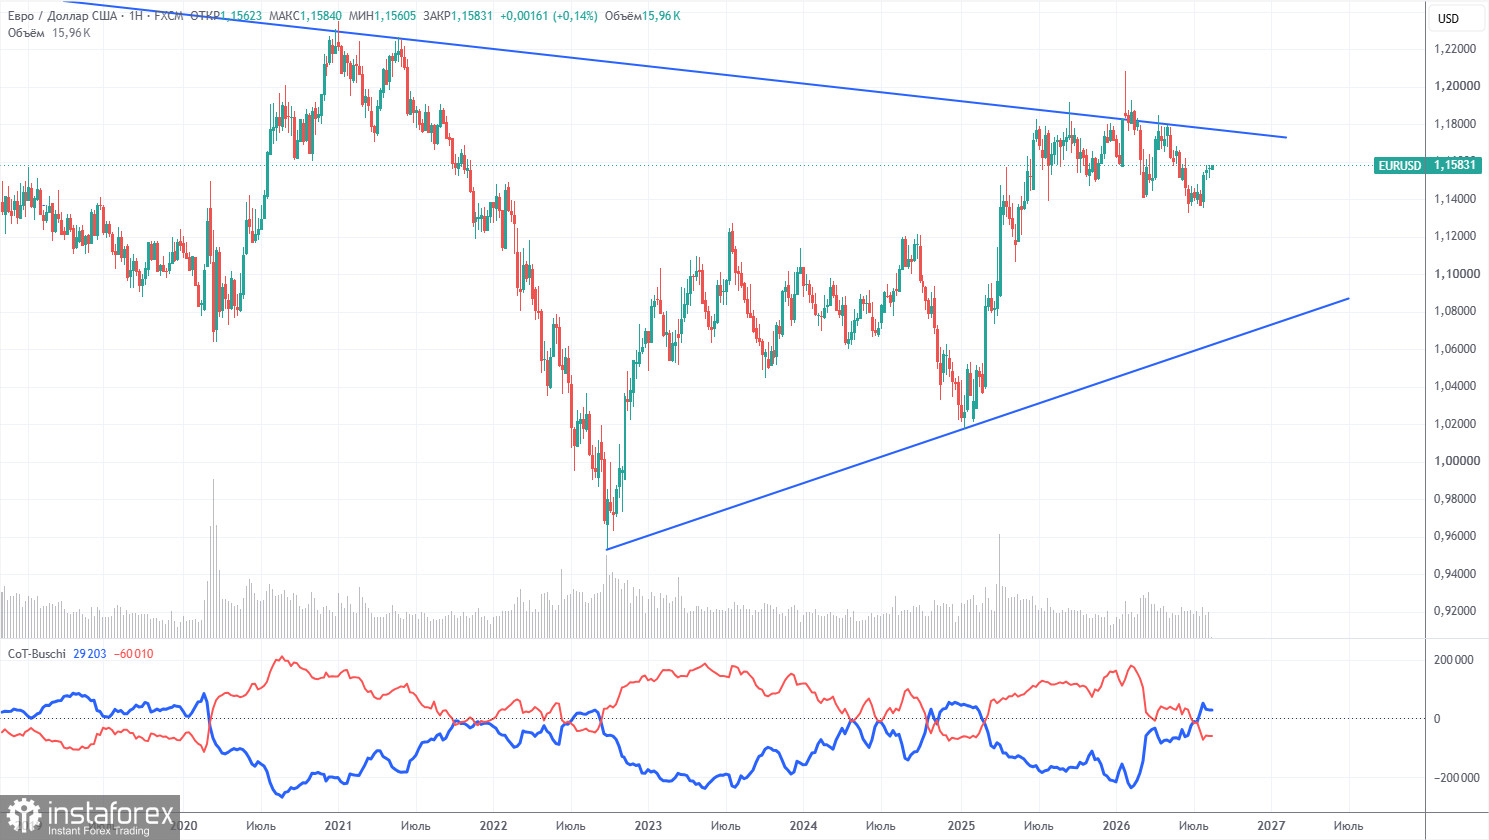
The latest COT report is dated August 11. The weekly TF illustration clearly shows that the net position of non-commercial traders has become "bearish" and has significantly decreased in 2026 due to geopolitical events. Traders have been shedding European currency in favor of the US dollar in recent months. Trump's policies have not changed, but the dollar served as a "reserve currency" for a time.
We still do not see any fundamental factors supporting the European currency, while there are enough factors indicating a fall for the American dollar. The war in the Middle East made the dollar temporarily super-attractive, but when this factor's "shelf life" expires, everything will revert to normal. And this process may have already concluded. In the long term, the euro could fall to the level of $1.08 (the trend line), but the upward trend will still remain relevant. Over the past months of dollar strengthening, the pair did not get too close to this line.
The positions of the red and blue lines of the indicator indicate parity between bulls and bears. During the last reporting week, the number of long positions in the "Non-commercial" group fell by 4,600, while the number of short positions decreased by 2,700. Consequently, the net position shrank by 1,900 contracts during the week.
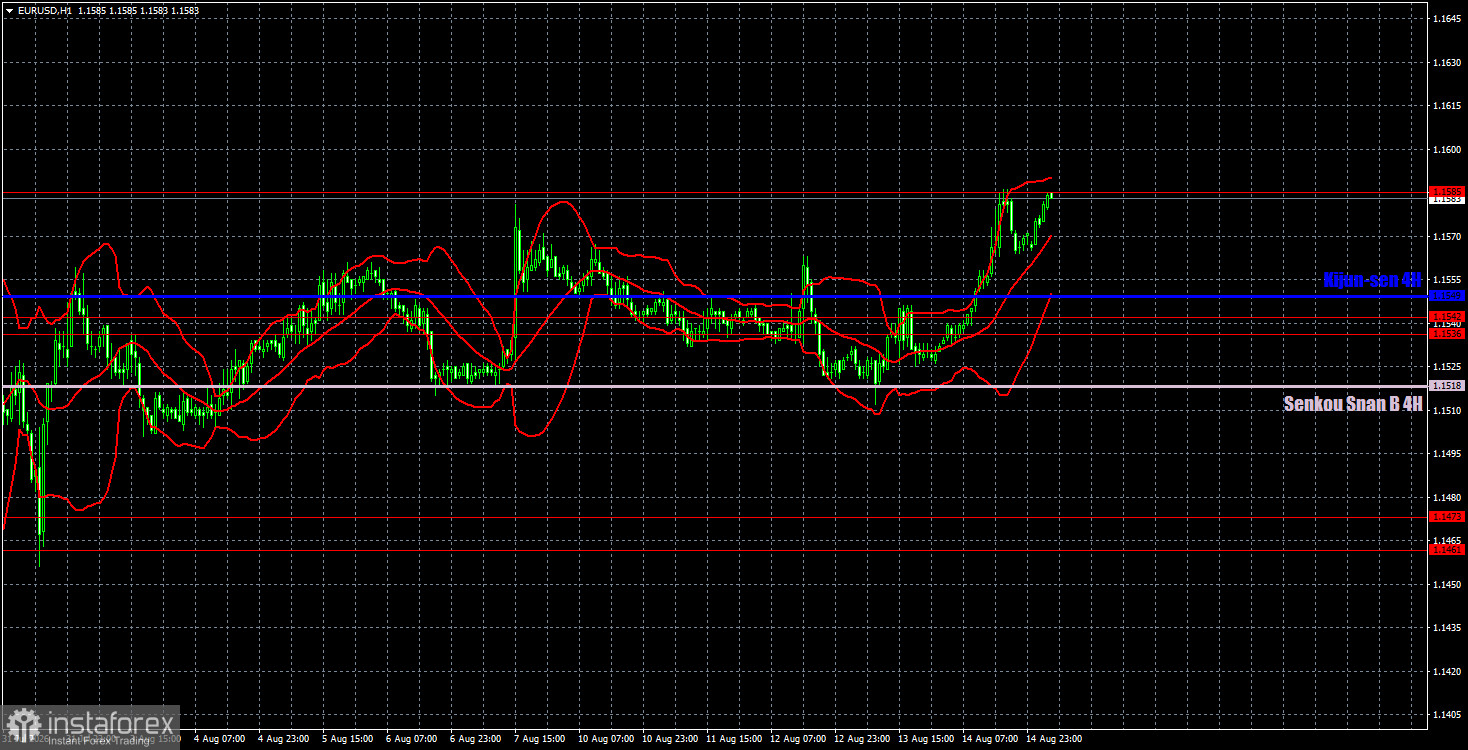
On the hourly timeframe, the pair maintains its upward trend, but in the last two weeks, it has moved more sideways than up or down. The situation in the Middle East remains tense and is not improving, but this is no longer sufficient for a new, powerful rise in the dollar. The market has ignored all positive factors for the euro in recent months and has focused solely on the Federal Reserve's monetary policy, placing excessive demands on it. Now, the European currency has every chance of medium-term growth.
For August 17, we highlight the following trading levels: 1.1234, 1.1274, 1.1362-1.1368, 1.1461-1.1473, 1.1536-1.1542, 1.1585, 1.1657-1.1666, 1.1750-1.1760, 1.1786, 1.1830-1.1837, as well as the Senkou Span B line (1.1518) and Kijun-sen (1.1549). The Ichimoku indicator lines may move during the day, which should be taken into account when determining trading signals. Don't forget to set stop-loss orders to break even if the price moves in the desired direction by 15 pips. This will protect against potential losses if the signal proves false.
On Monday, there are no important events or publications scheduled in the Eurozone or the US. Traders will have nothing to react to during the day, so volatility may be weak today. However, the euro may continue to rise.
Today, traders may consider short positions with targets of 1.1536-1.1542 if the pair bounces off 1.1585. A consolidation above 1.1585 will allow for long positions with targets in the 1.1657-1.1666 area.
Price support and resistance levels are thick red lines near which movement may end. They are not sources of trading signals.
The Kijun-sen and Senkou Span B lines are Ichimoku indicator lines transferred from the 4-hour timeframe to the hourly timeframe. They are strong lines.
Extreme levels are thin red lines from which price previously bounced. They are sources of trading signals.
Yellow lines denote trend lines, trend channels, and any other technical patterns.
Indicator 1 on COT charts shows the size of the net position of each category of traders.

