
यह भी देखें


 17.08.2026 11:31 AM
On the hourly chart, GBP/USD rose to the 100.0% retracement level at 1.3557 on Friday. Today, Monday, consolidation above this level would suggest a continuation of the rise toward the next Fibonacci level of 127.2% at 1.3633. A rejection from this level (unlikely) would favor the US dollar and a decline toward the 76.4% retracement level at 1.3489.
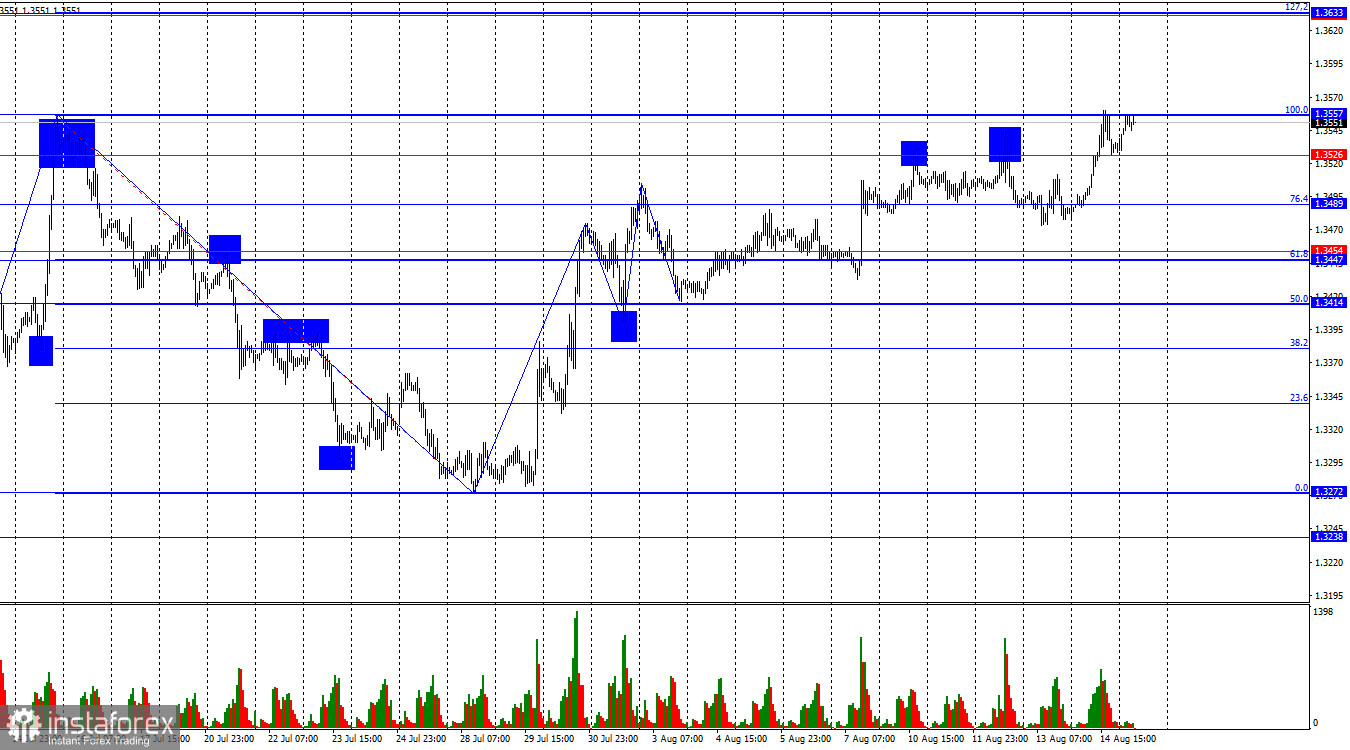
The situation has shifted to bullish, but only due to a significant reduction in the size of the identifiable waves. The latest completed downward wave did not break the previous low, while the latest upward wave (not yet complete) broke the previous high. Thus, the bulls currently have the initiative in the market, but their advantage is not particularly clear-cut. Three unsuccessful attempts to break through the 1.3526–1.3557 level could allow the bears to take the initiative.
The fundamental backdrop supported the bulls on Friday, but only in the second half of the day. In the first half, the bulls advanced on enthusiasm. In my view, the overall fundamental backdrop allows for further gains in the pound, as the key factors are currently in its favor. The market no longer expects the FOMC to tighten monetary policy at its next meeting, while, in addition, all the most important US economic data showed weak readings, making it extremely difficult for the bears to even mount counterattacks. Therefore, I believe the pound's rise will continue. This week, the UK will release a series of reports, including August business activity indices, the unemployment rate, and inflation data. The latter report will give traders a clue as to whether the Bank of England is likely to raise interest rates in September. And I believe it is. Back in the spring of this year, Andrew Bailey said that the central bank was prepared to tighten monetary policy if inflation accelerated. Inflation could rise to 3% in July. This is certainly not a level at which interest rates should be raised as soon as possible, but it is a level that could restore a hawkish stance. If the Strait of Hormuz remains closed, inflation could continue to rise.
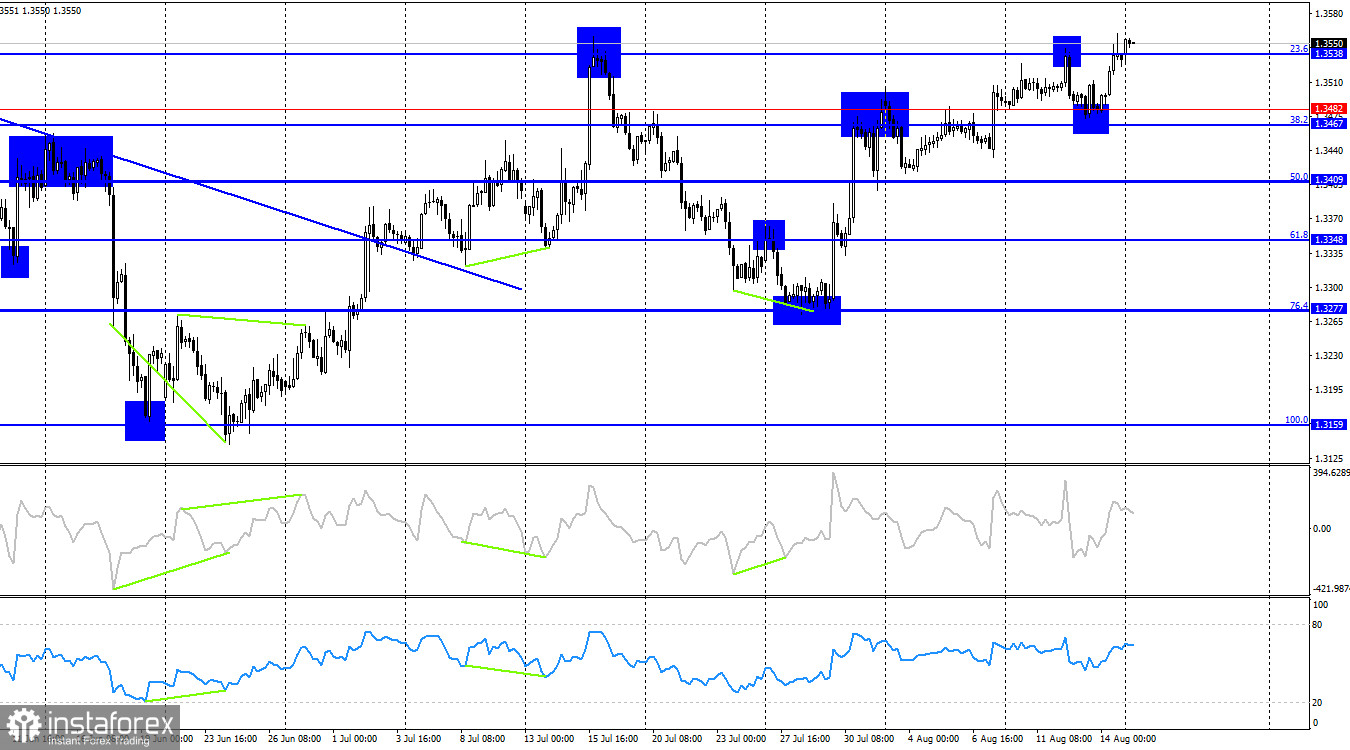
On the 4-hour chart, GBP/USD rebounded from the 1.3467–1.3482 support level, reversed in favor of the pound, and consolidated above the 23.6% retracement level at 1.3538. Thus, on the 4-hour chart, the pound also has grounds to continue rising toward the next Fibonacci level of 0.0% at 1.3657. No emerging divergences are currently observed in any of the indicators.
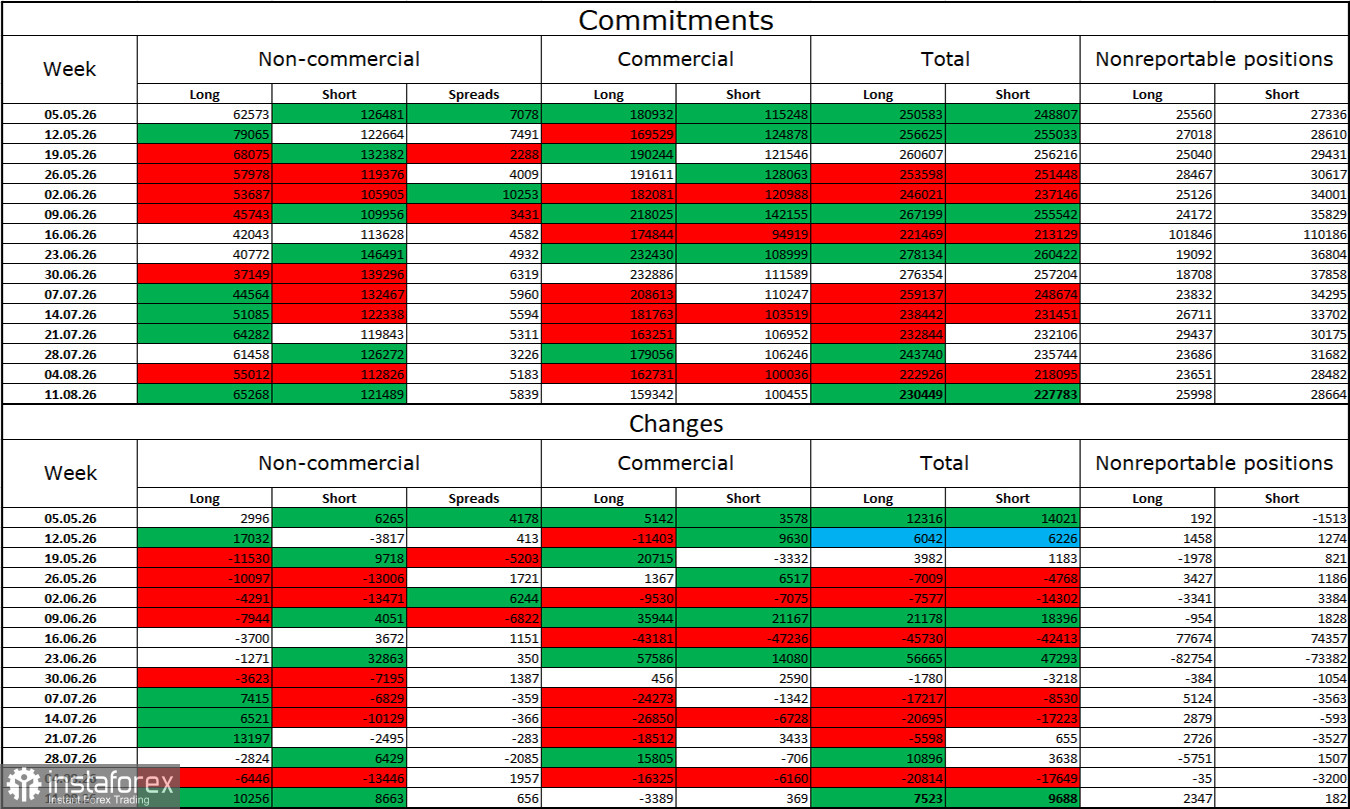
The sentiment of the "Non-commercial" trader category became slightly less bearish over the latest reporting week. The number of Long positions held by speculators increased by 10,256, while the number of Short positions increased by 8,663. The current gap between the number of Long and Short positions is effectively 65,000 versus 121,000. The gap and the bears' advantage are gradually narrowing, but the bears' advantage remains substantial. Previously, the bears' dominance was unquestionable, but this is no longer the case because the fundamental backdrop has changed.
I still do not believe in a bearish trend for the pound, but in the near term, everything will depend not on economic indicators, Trump's trade policy, or central banks' monetary policy, but on the duration, scale, and consequences of the war in the Middle East. In recent months, the market has shifted toward expectations of peace, but negotiations between Iran and the US failed before they had properly begun. And there is no guarantee that they will resume in the near future.
On August 17, the economic calendar contains no notable events. The economic backdrop will have no impact on market sentiment on Monday.
Selling the pair is possible today if there is a rejection from the 1.3557 level on the hourly chart, with a target of 1.3489. Buying is possible today if the price closes above the 1.3526–1.3557 level, with a target of 1.3633.
The Fibonacci levels are drawn from 1.3557–1.3272 on the hourly chart and from 1.3158–1.3655 on the 4-hour chart.

