Bearish Rectangle
was formed on 18.04 at 21:51:06 (UTC+0)
signal strength 2 of 5
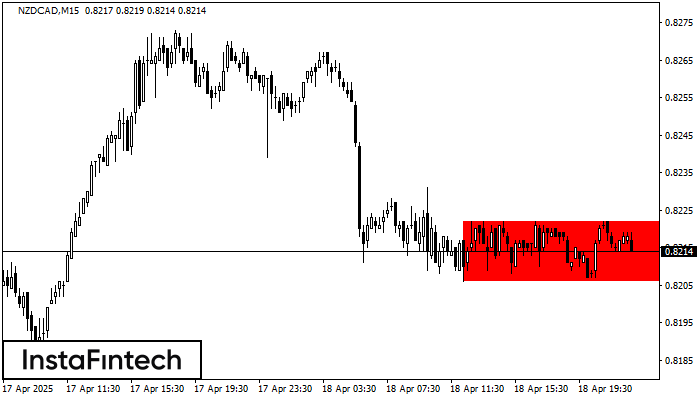
According to the chart of M15, NZDCAD formed the Bearish Rectangle. This type of a pattern indicates a trend continuation. It consists of two levels: resistance 0.8222 - 0.0000 and support 0.8206 – 0.8206. In case the resistance level 0.8206 - 0.8206 is broken, the instrument is likely to follow the bearish trend.
The M5 and M15 time frames may have more false entry points.
See Also
- All
- All
- Bearish Rectangle
- Bearish Symmetrical Triangle
- Bullish Rectangle
- Double Top
- Double Top
- Triple Bottom
- Triple Bottom
- Triple Top
- Triple Top
- All
- All
- Buy
- Sale
- All
- 1
- 2
- 3
- 4
- 5
डबल टॉप
was formed on 13.08 at 15:39:42 (UTC+0)
signal strength 1 of 5
GBPAUD M5 पर डबल टॉप रीवर्सल पैटर्न बना है। विशेषताएं: ऊपरी सीमा 2.0724; निचली सीमा 2.0710; पैटर्न की चौड़ाई 13 पॉइंट्स है। सेल ट्रेडों को 2.0710 की निचली सीमा के
M5 और M15 समय सीमा में अधिक फाल्स एंट्री पॉइंट्स हो सकते हैं।
Open chart in a new window
बुलिश फ्लैग
was formed on 13.08 at 15:30:00 (UTC+0)
signal strength 5 of 5
बुलिश फ्लैग पैटर्न जो एक प्रवृत्ति के जारी रहने का संकेत देता है, चार्ट #NTDOY D1 पर बना है। पूर्वानुमान: यदि कीमत 24.49 के पैटर्न की उचाई से ऊपर टूटती
Open chart in a new window
बुलिश पताका
was formed on 13.08 at 15:29:55 (UTC+0)
signal strength 5 of 5
बुलिश पताका सिग्नल - ट्रेडिंग इंस्ट्रूमेंट #NTDOY D1, निरंतरता पैटर्न। पूर्वानुमान: पैटर्न के उच्च 24.49 के ऊपर एक खरीद स्थिति सेट करना संभव है, इसके साथ अगला कदम फ्लैगपोल ऊंचाई
Open chart in a new window