Bullish pennant
was formed on 21.04 at 07:00:12 (UTC+0)
signal strength 3 of 5
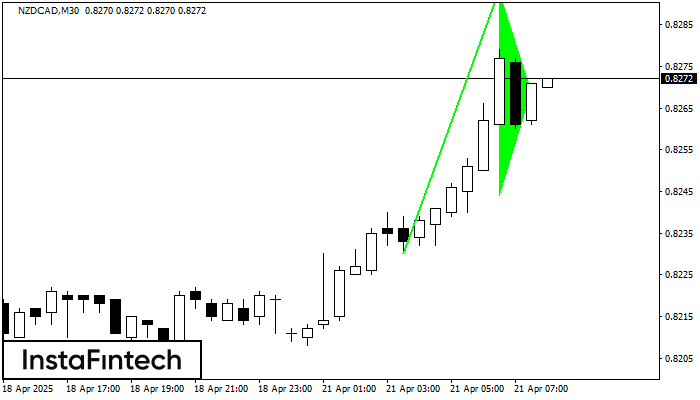
The Bullish pennant graphic pattern has formed on the NZDCAD M30 instrument. This pattern type falls under the category of continuation patterns. In this case, if the quote can breaks out high, is expected to continue the upward trend to level 0.8323.
See Also
- All
- All
- Bearish Rectangle
- Bearish Symmetrical Triangle
- Bullish Rectangle
- Double Top
- Double Top
- Triple Bottom
- Triple Bottom
- Triple Top
- Triple Top
- All
- All
- Buy
- Sale
- All
- 1
- 2
- 3
- 4
- 5
बियरिश फ्लैग
was formed on 11.08 at 14:14:37 (UTC+0)
signal strength 1 of 5
बियरिश फ्लैग पैटर्न NZDUSD पर M5 पर बना है। पैटर्न की निचली सीमा 0.5922/0.5928 पर स्थित है जबकि ऊपरी सीमा 0.5926/0.5932 पर स्थित है। फ्लैगपोल का प्रक्षेपण 13 पॉइंट्स है।
M5 और M15 समय सीमा में अधिक फाल्स एंट्री पॉइंट्स हो सकते हैं।
Open chart in a new window
बियरिश पताका
was formed on 11.08 at 14:14:32 (UTC+0)
signal strength 1 of 5
बियरिश पताका पैटर्न NZDUSD M5 चार्ट पर बना है। यह मौजूदा ट्रेंड कि संभावित निरंतरता का संकेत देता है। निर्दिष्टीकरण: पैटर्न का नीचल स्तर 0.5922 पर है; फ्लैगपोल की ऊंचाई
M5 और M15 समय सीमा में अधिक फाल्स एंट्री पॉइंट्स हो सकते हैं।
Open chart in a new window
हेड एण्ड शोल्डर्स
was formed on 11.08 at 12:00:19 (UTC+0)
signal strength 3 of 5
हेड एण्ड शोल्डर्स नामक तकनीकी पैटर्न GBPUSD M30 के चार्ट पर प्रदर्शित हुआ है। वजनदार कारणों से यह सुझाव दिया जाता है कि दाहिना शोल्डर बनने के बाद कीमत नेकलाइन
Open chart in a new window