Бычий вымпел
сформирован 09.06 в 11:21:46 (UTC+0)
сила сигнала 2 из 5

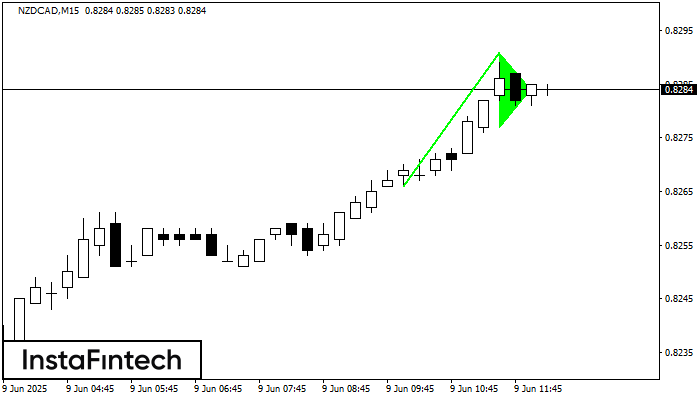
Графическая фигура «Бычий вымпел» сформировалась по инструменту NZDCAD на M15. Данный вид фигуры относится к типу продолжения тенденции. В случае если котировке удастся преодолеть максимум вымпела 0.8291, то ожидается продолжение восходящего тренда к уровню 0.8314.
Таймфреймы М5 и М15 могут иметь больше ложных точек входа.
Сондай-ақ қараңыз
- Все
- Все
- Bearish Rectangle
- Bearish Symmetrical Triangle
- Bullish Rectangle
- Double Top
- Double Top
- Triple Bottom
- Triple Bottom
- Triple Top
- Triple Top
- Все
- Все
- Покупка
- Продажа
- Все
- 1
- 2
- 3
- 4
- 5
Double Top
was formed on 23.09 at 03:00:41 (UTC+0)
signal strength 3 of 5
On the chart of AUDCAD M30 the Double Top reversal pattern has been formed. Characteristics: the upper boundary 0.9123; the lower boundary 0.9110; the width of the pattern 13 points
Open chart in a new window
Triple Top
was formed on 23.09 at 02:30:27 (UTC+0)
signal strength 3 of 5
On the chart of the AUDUSD M30 trading instrument, the Triple Top pattern that signals a trend change has formed. It is possible that after formation of the third peak
Open chart in a new window
Bullish Symmetrical Triangle
was formed on 22.09 at 20:17:21 (UTC+0)
signal strength 2 of 5
According to the chart of M15, GBPCHF formed the Bullish Symmetrical Triangle pattern. Description: This is the pattern of a trend continuation. 1.0731 and 1.0691 are the coordinates
The M5 and M15 time frames may have more false entry points.
Open chart in a new window