
Lihat juga


 15.07.2026 07:46 AM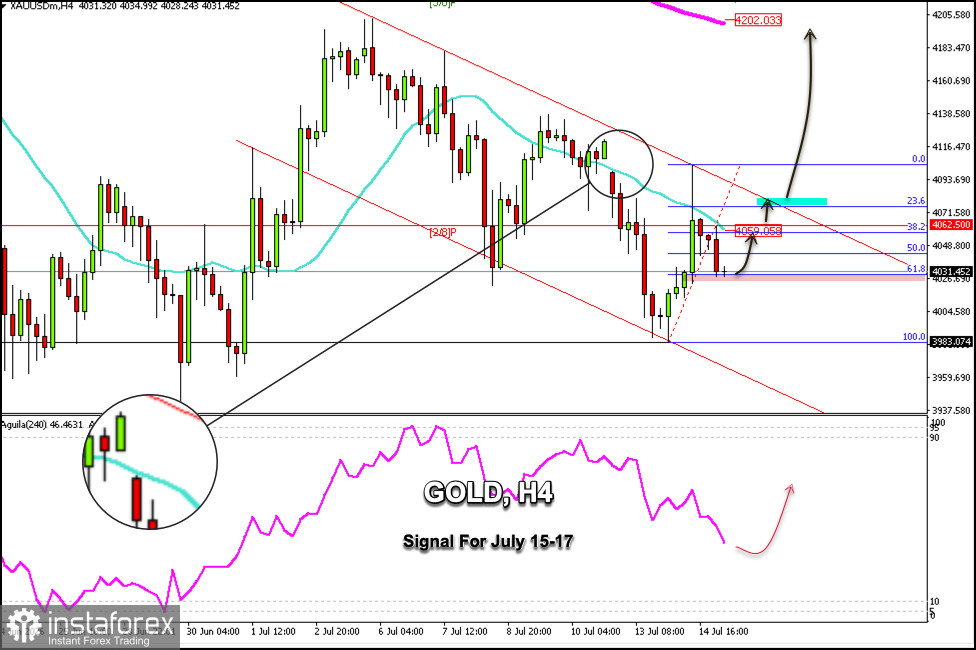
Gold is trading around $4,031 after pulling back from a high of about $4,103—a level that coincided with the upper band of the downtrend channel. Since then, according to the H4 chart, we have observed a technical correction.
Looking at the Fibonacci indicator, we see that gold has pulled back toward the 61.8% level. Therefore, we would expect that gold will resume its uptrend above $4,030 or the psychological level of $4,000. If this scenario plays out, XAU could reach $4,069, near the 21-period simple moving average (SMA), and ultimately reach the upper band of the uptrend channel at about $4,195.
If gold falls below the 61.8% Fibonacci level, the downtrend is expected to continue, potentially reaching the July 13 low, around $3,983.
Since gold has not yet fully recovered and has left a gap at $4,121, the uptrend will likely continue in the coming days, so we could look for buying opportunities above $4,000.
A decisive break above the downtrend channel could present an opportunity to buy gold if it consolidates above $4,080. In that case, XAU could close the gap left around $4,121 and, ultimately, reach the 200-day moving average around $4,202.
You have already liked this post today
* Analisis pasaran yang disiarkan di sini adalah bertujuan untuk meningkatkan kesedaran anda, tetapi tidak untuk memberi arahan untuk membuat perdagangan.


