Lihat juga

 25.03.2026 07:05 AM
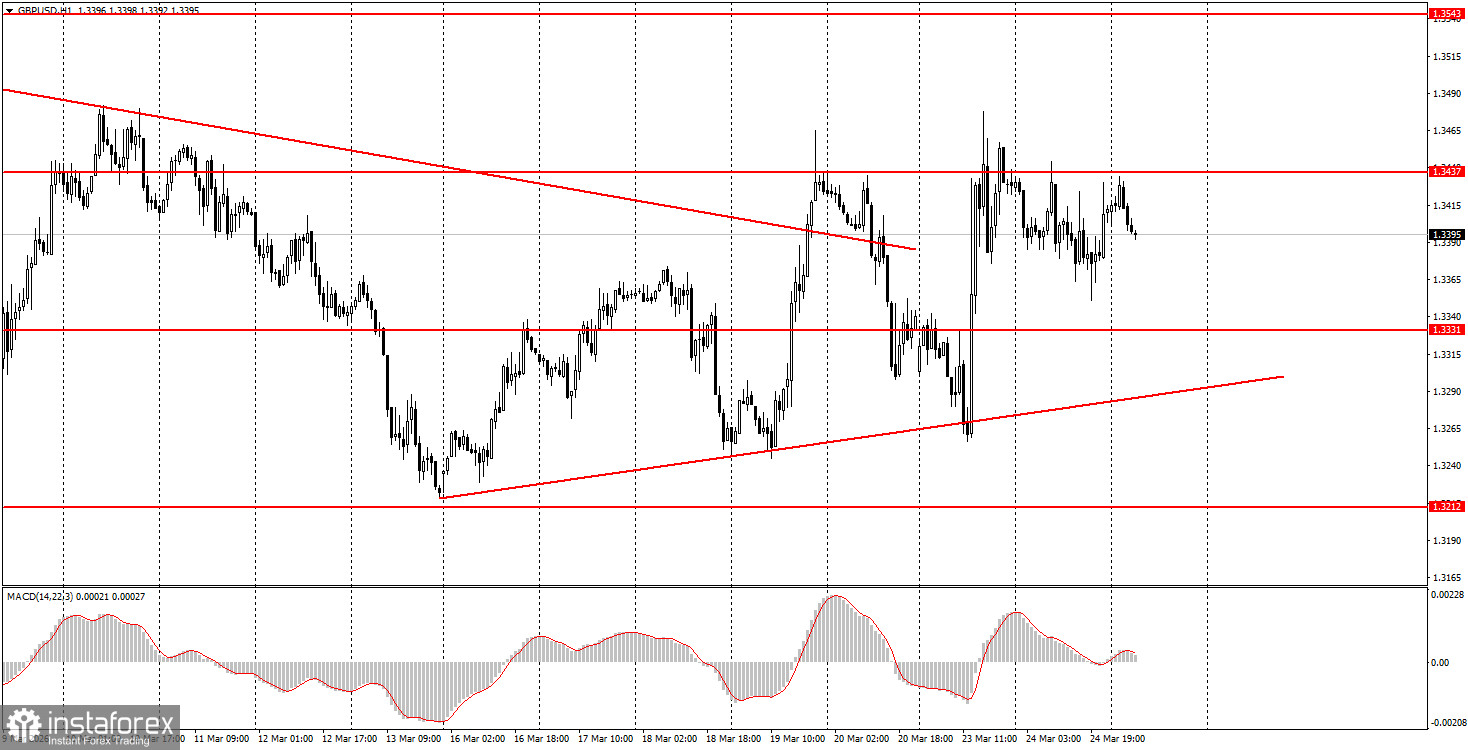
The GBP/USD pair showed no interesting movements on Tuesday. There was no news from the Middle East or Donald Trump, so the market rightfully decided to wait and not get distracted by secondary macroeconomic data. In principle, we have repeatedly noted that the macroeconomic backdrop has been largely ignored by traders over the past month. Otherwise, the US dollar wouldn't be so expensive. Yesterday, we received further confirmation of this. Business activity indices in the UK were weaker than expected, but overall, they did not create any problems for the British currency. American indices showed secondary values, but the market ignored those as well. Everyone is waiting for the resolution of the situation with Iran. Either the US and Iran will move towards de-escalation, or the conflict will continue for many months. Thus, the future of the GBP/USD pair remains influenced by geopolitics.
On the hourly timeframe, the GBP/USD pair has begun to form an upward trend, but this trend is very strange and uncertain. There are no global factors driving medium-term dollar growth, so in 2026 we expect the global upward trend to resume from 2025, which could push the pair to a low of 1.4000. However, this requires a decrease in global geopolitical tensions.
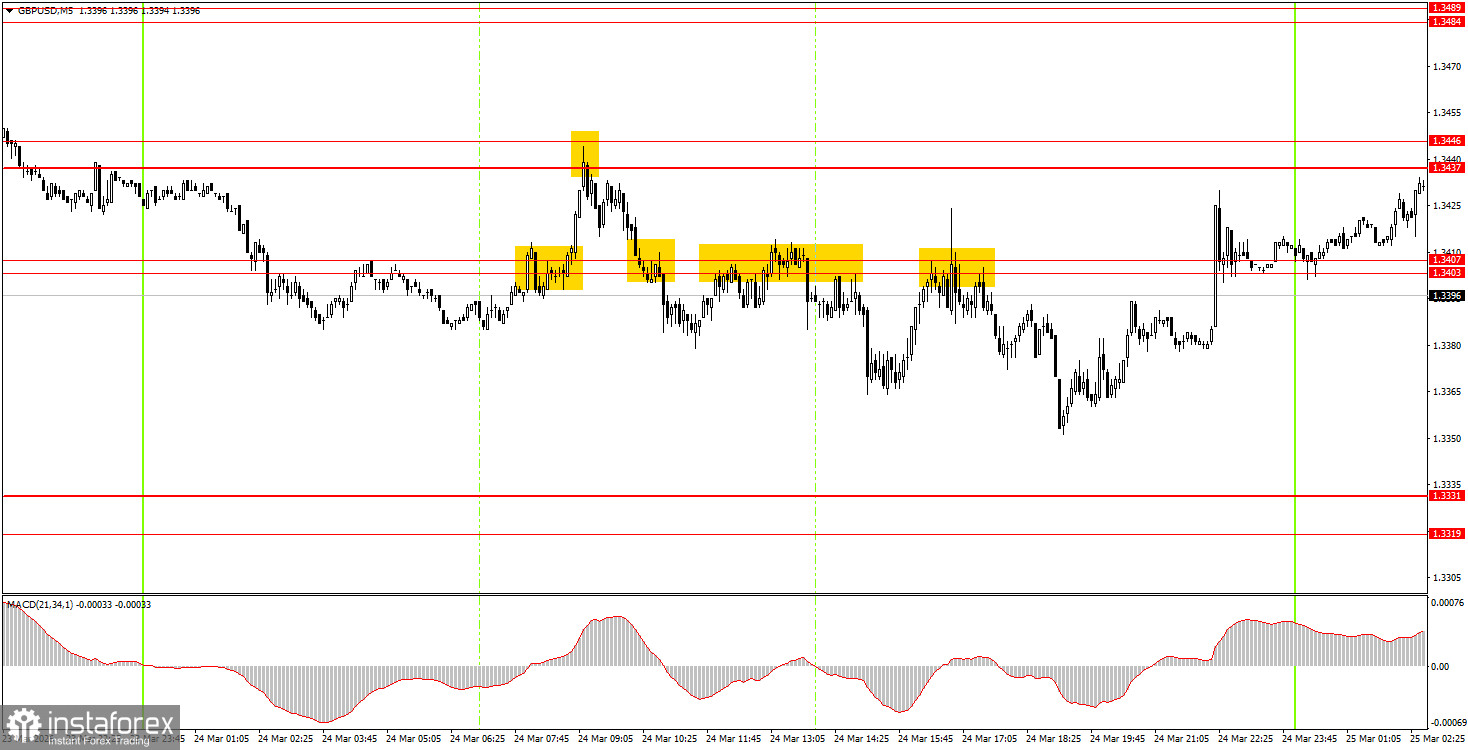
On Wednesday, beginner traders may consider short positions if the price consolidates below the 1.3403-1.3407 range, targeting 1.3319-1.3331. If the price consolidates above the 1.3403-1.3407 area, long positions can be opened with targets at 1.3437-1.3446 and 1.3484-1.3489.
On the 5-minute timeframe, the following levels should currently be monitored: 1.3096-1.3107, 1.3203-1.3212, 1.3259-1.3267, 1.3319-1.3331, 1.3403-1.3407, 1.3437-1.3446, 1.3484-1.3489, 1.3529-1.3543, 1.3643-1.3652, 1.3695, 1.3741-1.3751. Today, an important inflation report for February will be released in the UK; however, the market's reaction will depend not on the report's mere existence but on its significance. If inflation does not reach 3% (the forecast), trader reactions can be expected.
Price levels of support and resistance are levels that serve as targets when opening buys or sells. Take Profit levels can be placed around them.
Red lines represent channels or trend lines that show the current trend and indicate the direction in which it is preferable to trade now.
The MACD indicator (14,22,3) – the histogram and the signal line – is a supporting indicator that can also be used as a source of signals.
Important speeches and reports (always included in the news calendar) can significantly affect the movement of the currency pair. Therefore, during their release, trading should be done with utmost caution, or traders should exit the market to avoid sharp price reversals against the previous movement.
Beginning traders in the forex market should remember that not every trade can be profitable. Developing a clear strategy and effective money management are the keys to long-term trading success.


