
Lihat juga


 13.07.2026 05:20 AM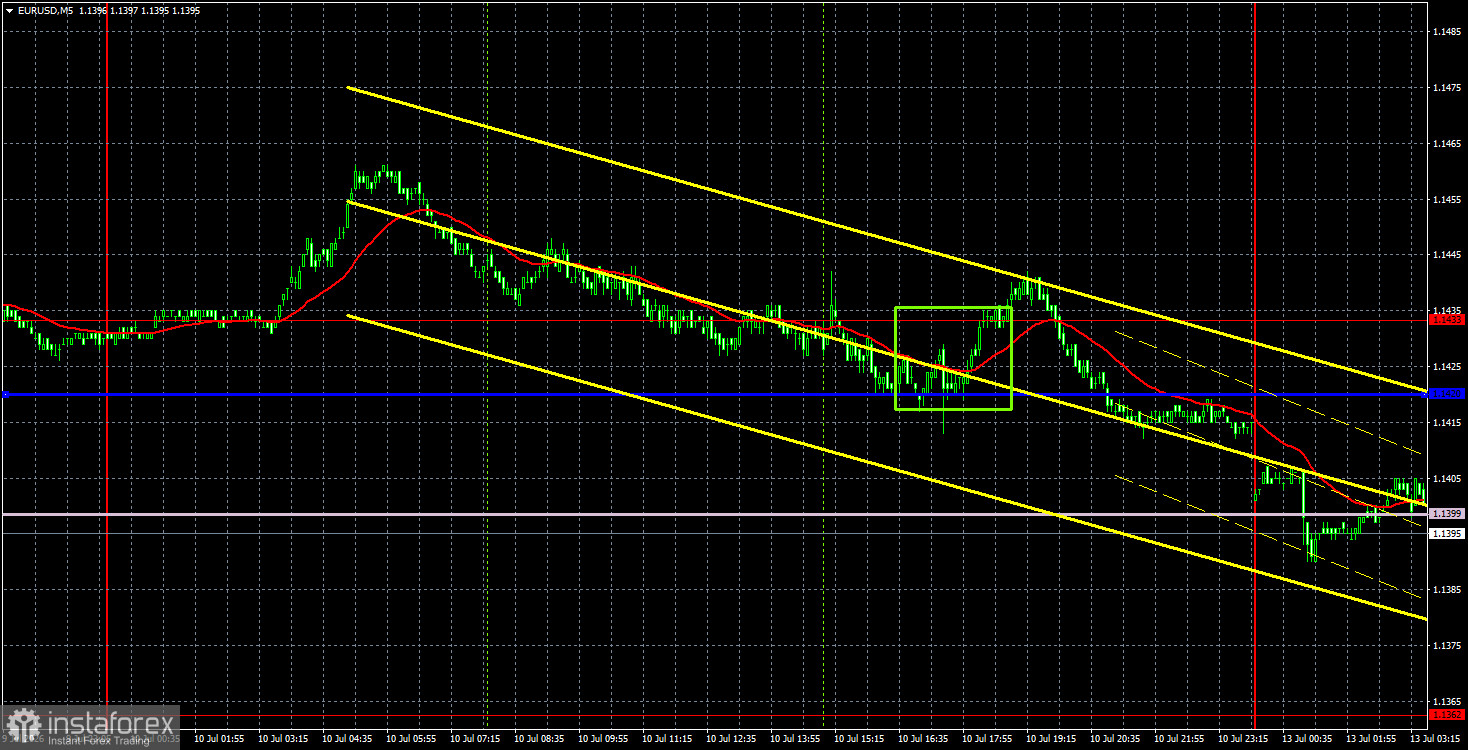
The EUR/USD currency pair continued to trade with low volatility on Friday and primarily sideways. Overall, we have observed low-volatility movement for the seventh consecutive day, exhibiting all the signs of a flat. This is not surprising, as there were very few significant events last week, and the market is no longer paying as much attention to geopolitics as it did in February or March. Negotiations between Iran and the U.S. are once again at risk of collapse; the new round of talks scheduled for July 11 did not take place, and yesterday Iran attacked commercial ships in the Strait of Hormuz, as well as U.S. military bases located on the territory of allies. This morning it became known that Tehran decided to impose a new blockade on the strait. The "Santa Barbara" in the Middle East continues.
From a technical perspective, the upward trend remains, but the euro is growing extremely weakly. The trend line has been broken twice, and the price may already be consolidating below the Senkou Span B line today. We do not see clear reasons for a new rise in the U.S. dollar, but if the Senkou Span B line is surpassed, this will indicate a very likely resumption of the downward trend that began two months ago. So far, everything is heading in that direction.
On the 5-minute timeframe, only one trading signal was generated on Friday, which made no sense to execute. At the end of the week and the day, the price bounced from the 1.1420-1.1433 area but failed to move higher by even 10 pips. In any case, opening trades before the market closes made no sense.
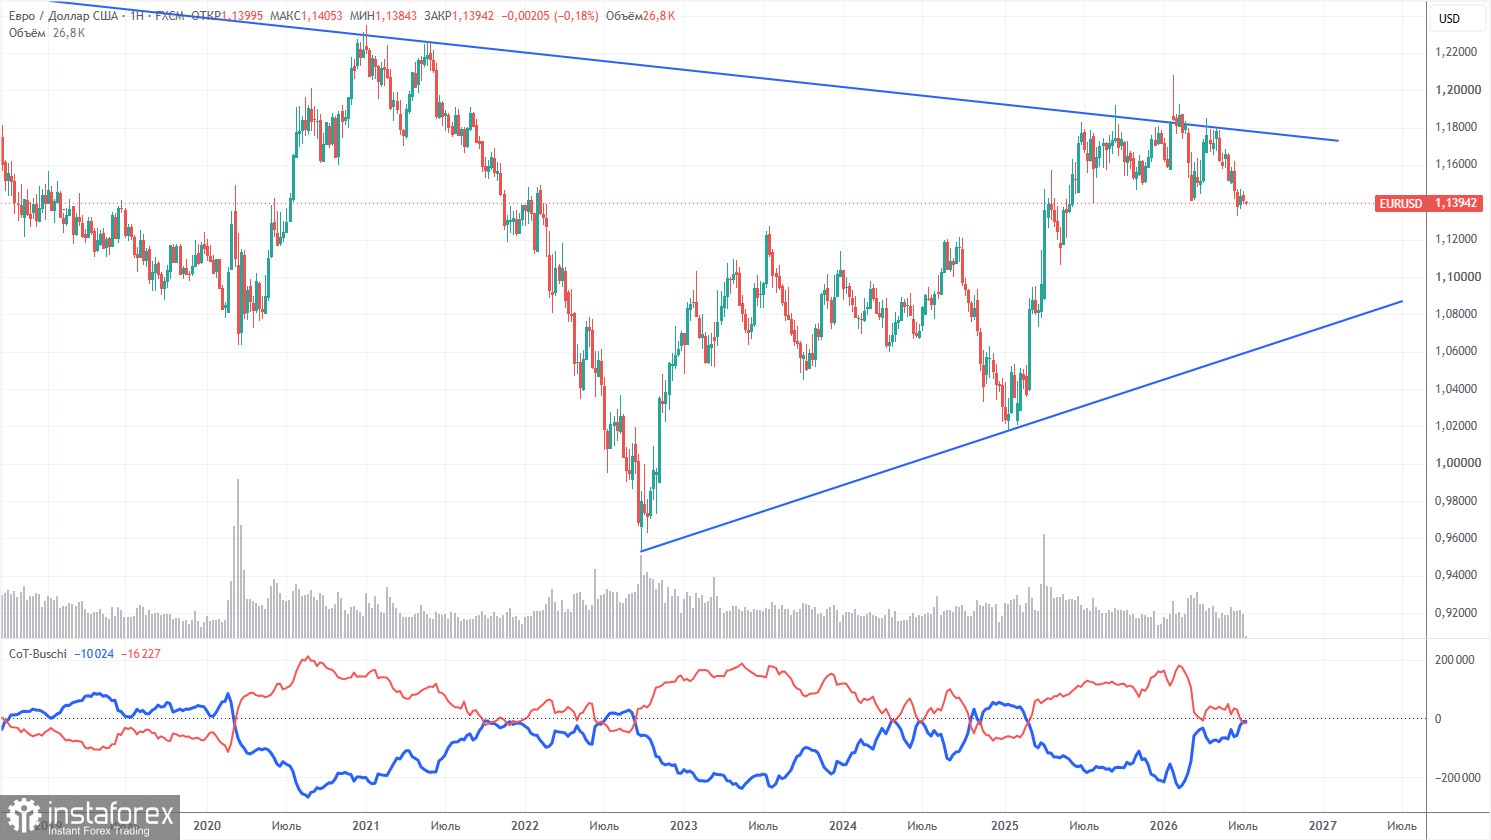
The latest COT report is dated July 7. The weekly timeframe illustration clearly shows that the net position of non-commercial traders remains "bullish" but has significantly decreased due to geopolitical events. Traders have been shedding the European currency in favor of the U.S. dollar in recent months. Donald Trump's policies have not changed, but the dollar has temporarily acted as a "reserve currency." However, this process may have already been completed.
We still do not see any fundamental factors to strengthen the European currency, while there remain enough factors for the U.S. dollar to decline. The war in the Middle East has made the dollar temporarily super attractive, but when this factor reaches its "expiration date," everything will revert to the norm. And it may have already expired. In the long term, the euro could fall to the level of $1.08 (the trend line), but the upward trend will still remain relevant. Over the past months of dollar growth, the pair has not approached this line significantly.
The position of the red and blue lines of the indicator indicates parity between bulls and bears. Over the last reporting week, the number of longs in the "Non-commercial" group decreased by 12,200, while the number of shorts increased by 5,100. Consequently, the net position fell by 17,300 contracts over the week.
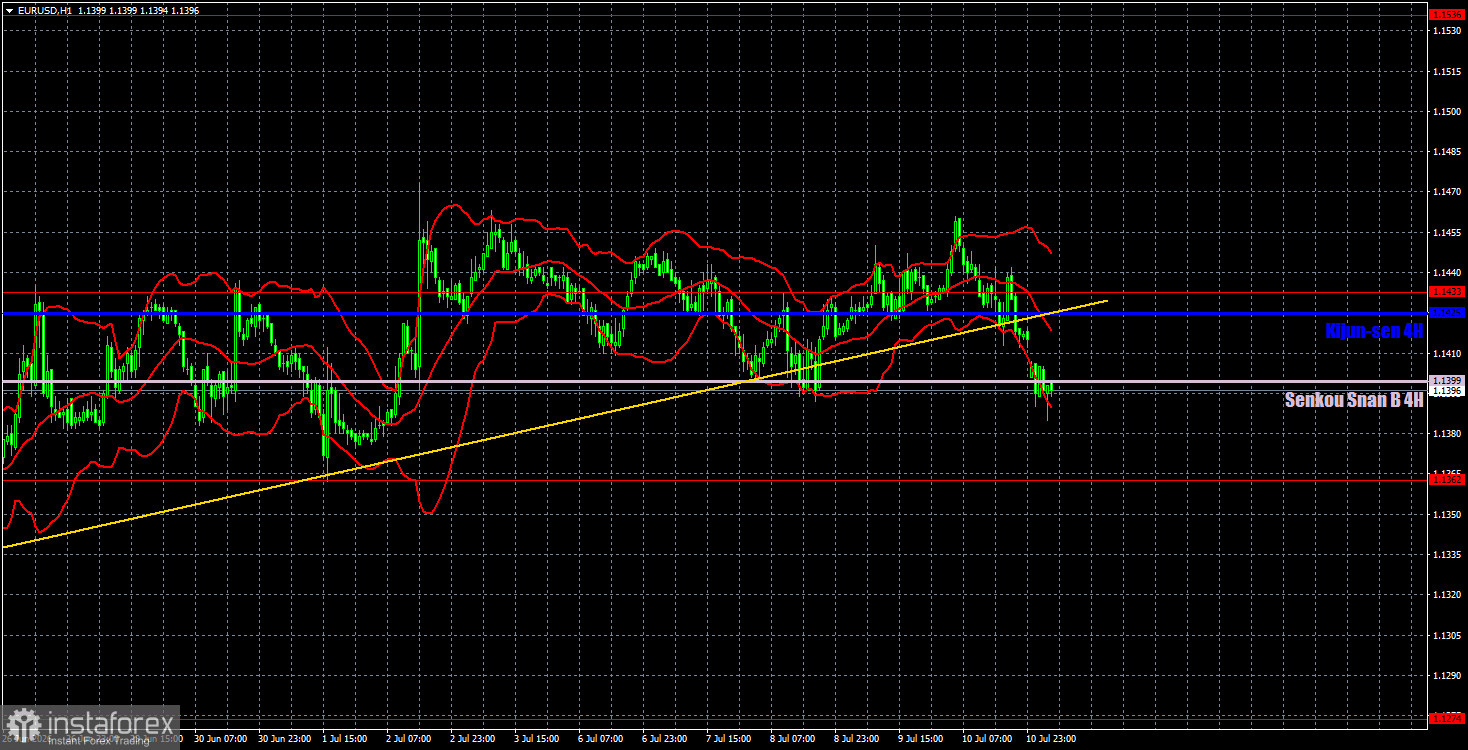
On the hourly timeframe, a corrective upward trend continues to form within the framework of a two-month downward trend. The situation in the Middle East remains tense, but we do not believe that the recent bombings by Iran and the U.S. or uncertainty in the negotiations and prospects for a deal are substantial reasons for further strengthening of the dollar. The market continues to ignore many factors favorable to the euro, so the pair's decline may resume as early as this week.
For July 13, we highlight the following levels for trading: 1.1234, 1.1274, 1.1362, 1.1433, 1.1536-1.1542, 1.1585, 1.1657-1.1666, 1.1750-1.1760, 1.1786, 1.1830-1.1837, as well as the Senkou Span B line (1.1399) and Kijun-sen (1.1425). The lines of the Ichimoku indicator may shift throughout the day, which should be considered when determining trading signals. Don't forget to set stop-loss orders to break even if the price moves in the right direction by 15 pips. This will protect against potential losses if the signal proves to be false.
No significant events are scheduled for Monday. Thus, today the market may react only to geopolitical events, which may again support the U.S. dollar. We do not believe that there will be high volatility today, but the EUR/USD pair may gradually slide downwards.
Today, traders may consider short positions with targets of 1.1362 and 1.1274 if the price consolidates below the Senkou Span B line. Long positions can be maintained with a target of 1.1425-1.1433 in the event of a price bounce from the 1.1362 level, which could serve as the lower boundary of the sideways channel. Volatility remains weak.
Price support and resistance levels are marked with thick red lines, around which price movements may end. They are not sources of trading signals.
The Kijun-sen and Senkou Span B lines are Ichimoku indicator lines transferred to the hourly timeframe from the four-hour one. They are strong lines.
Extreme levels are marked with thin red lines from which the price previously bounced. They serve as sources of trading signals.
Yellow lines represent trend lines, trending channels, and any other technical patterns.
Indicator 1 on the COT charts shows the size of the net position for each category of traders.


