Прямоугольник
сформирован 24.04 в 15:53:32 (UTC+0)
сила сигнала 3 из 5

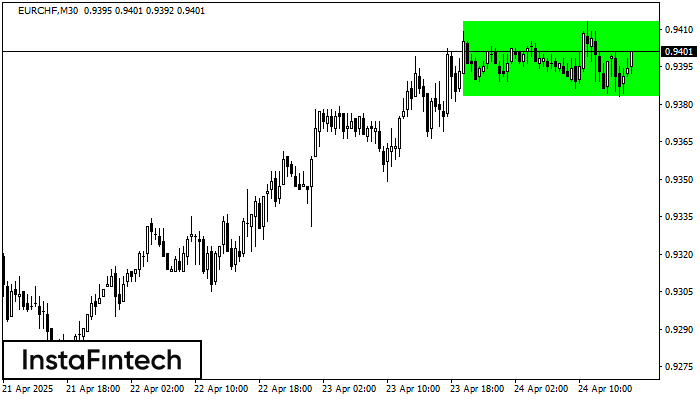
По торговому инструменту EURCHF на M30 сформировалась фигура продолжения тренда - «Прямоугольник». Фигура имеет границы: Нижняя 0.9383; Верхняя 0.9413. В случае пробоя верхней границы вероятно дальнейшее движение в сторону тренда.
Шунингдек кўринг
- Все
- Все
- Bearish Rectangle
- Bearish Symmetrical Triangle
- Bullish Rectangle
- Double Top
- Double Top
- Triple Bottom
- Triple Bottom
- Triple Top
- Triple Top
- Все
- Все
- Покупка
- Продажа
- Все
- 1
- 2
- 3
- 4
- 5
Double Bottom
was formed on 19.08 at 03:00:49 (UTC+0)
signal strength 4 of 5
The Double Bottom pattern has been formed on AUDCAD H1; the upper boundary is 0.9000; the lower boundary is 0.8952. The width of the pattern is 50 points. In case
Open chart in a new window
Bullish Rectangle
was formed on 19.08 at 00:09:48 (UTC+0)
signal strength 1 of 5
According to the chart of M5, AUDJPY formed the Bullish Rectangle. The pattern indicates a trend continuation. The upper border is 95.99, the lower border is 95.89. The signal means
The M5 and M15 time frames may have more false entry points.
Open chart in a new window
Bearish Symmetrical Triangle
was formed on 18.08 at 23:14:57 (UTC+0)
signal strength 1 of 5
According to the chart of M5, GBPJPY formed the Bearish Symmetrical Triangle pattern. This pattern signals a further downward trend in case the lower border 199.54 is breached. Here
The M5 and M15 time frames may have more false entry points.
Open chart in a new window