یہ بھی دیکھیں

 16.08.2023 07:37 AM
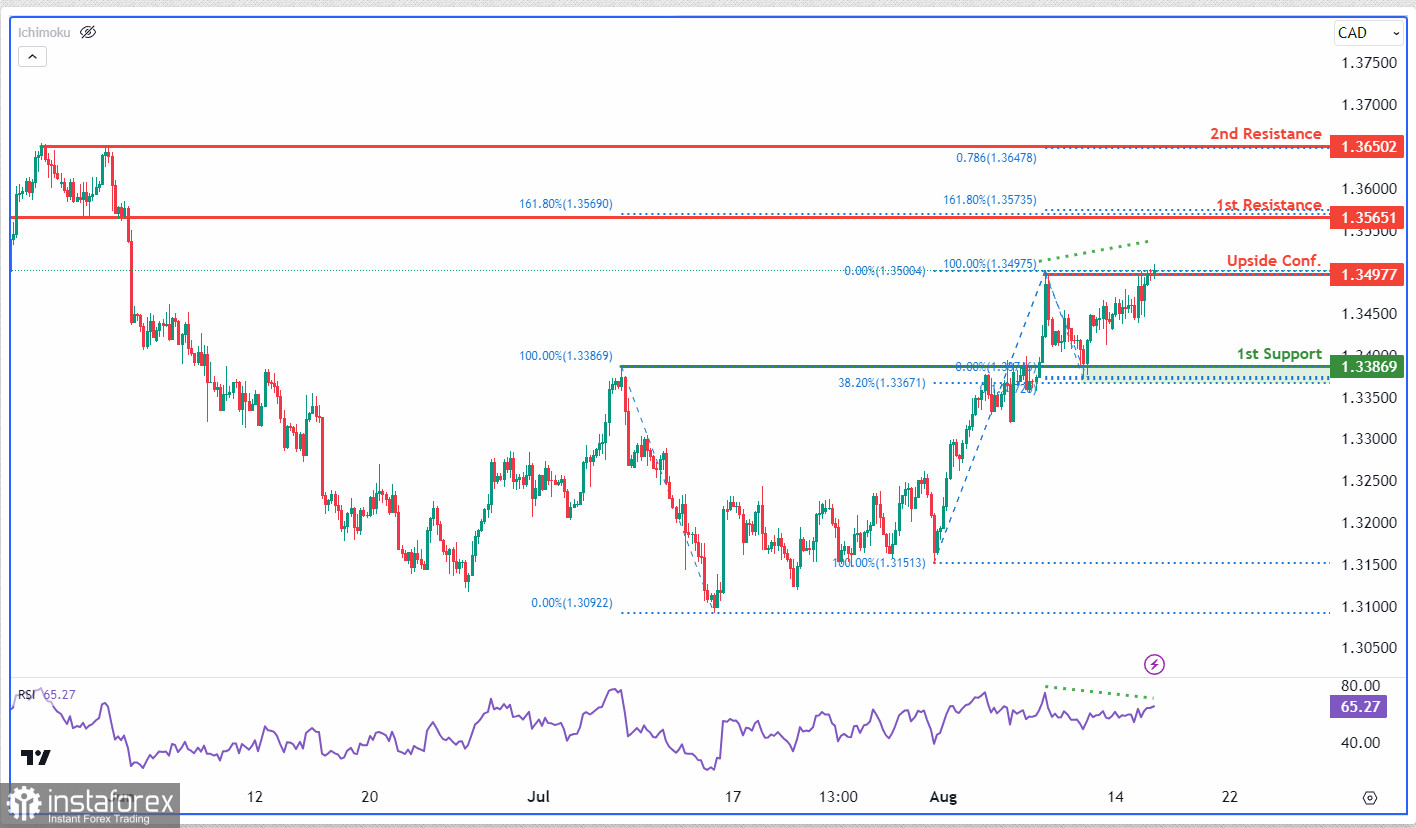
The USD/CAD chart currently reflects a bullish trend, with the potential for continued upward movement if the price surpasses and sustains above the 1.3498 confirmation level. However, a bearish RSI divergence suggests the need for caution regarding a possible reversal. Key resistance levels include the 1.3565 overlap resistance with multiple Fibonacci confluences, and the 1.3650 overlap resistance aligned with the 78.60% Fibonacci projection. On the support side, the 1.3387 overlap support, reinforced by the 38.20% Fibonacci retracement, holds significance.
You have already liked this post today
*تعینات کیا مراد ہے مارکیٹ کے تجزیات یہاں ارسال کیے جاتے ہیں جس کا مقصد آپ کی بیداری بڑھانا ہے، لیکن تجارت کرنے کے لئے ہدایات دینا نہیں.


