یہ بھی دیکھیں

 21.12.2023 11:00 AM
Technical analysis:
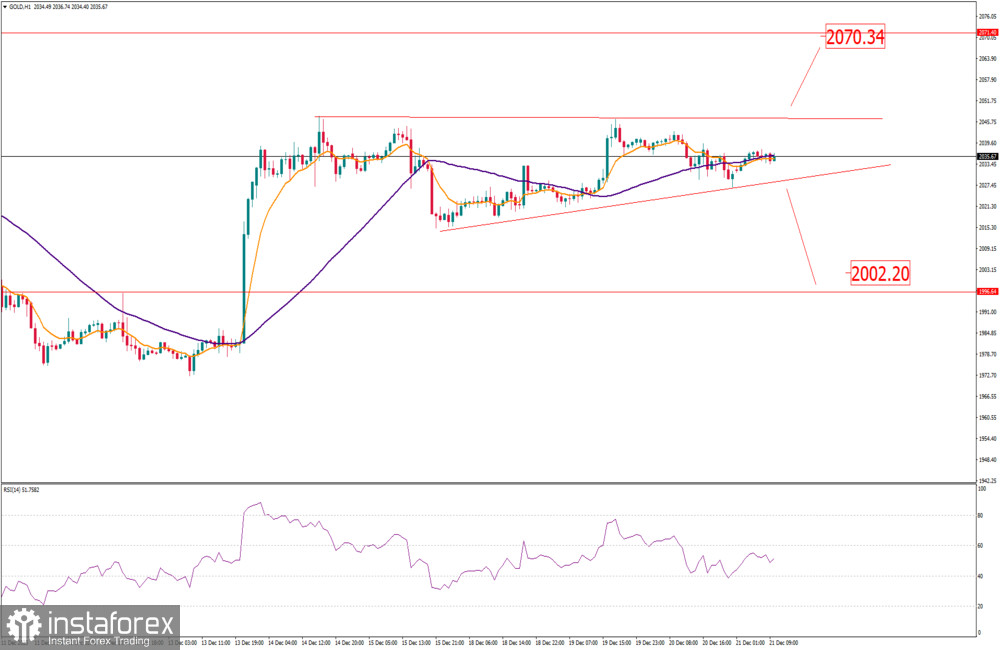
Gold has been trading sideways at the price of $2.035 and there is potential for the potetnial breakout of the triangle pattern.
In case of the upside breakout of the resistance at $2.050, there is the chance for the rally towards upside reference at $2.070
In case of the downside breakout of the support at $2.025, there is the chance for the further drop towards $2.000
RSI oscillator is showing reading around 50, which is the sign for the indecision.
You have already liked this post today
*تعینات کیا مراد ہے مارکیٹ کے تجزیات یہاں ارسال کیے جاتے ہیں جس کا مقصد آپ کی بیداری بڑھانا ہے، لیکن تجارت کرنے کے لئے ہدایات دینا نہیں.


