empty
10.03.2025 09:49 AM
EUR/USD and GBP/USD March 10 – Technical Analysis

EUR/USD

This image is no longer relevant

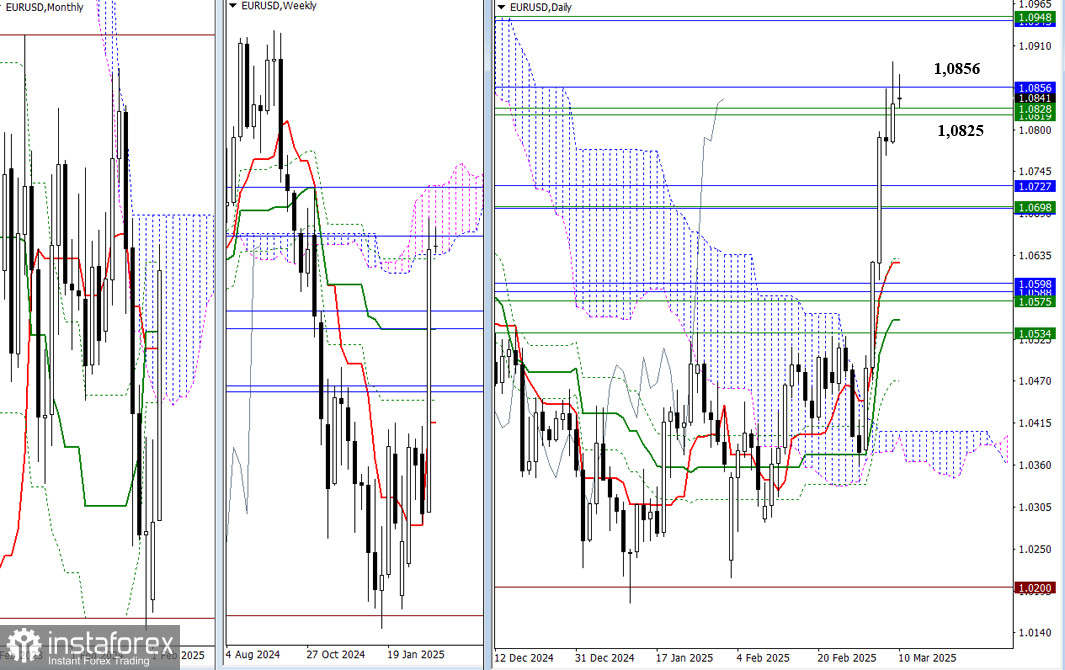
Last week, the EUR/USD pair closed within the weekly cloud, with the lower boundary at 1.0825. It reached the final level of the monthly Ichimoku cross at 1.0856. If the pair successfully overcomes these resistance levels, it will pave the way to the upper boundaries of the Ichimoku cloud at the monthly level (1.0943) and the weekly level (1.0948). Conversely, a rebound from the tested range of 1.0825 to 1.0856 could push the pair back toward previous clusters of resistance around 1.0727 to 1.0696, which align with the weekly medium-term trend as well as the monthly Tenkan and Kijun lines.

This image is no longer relevant

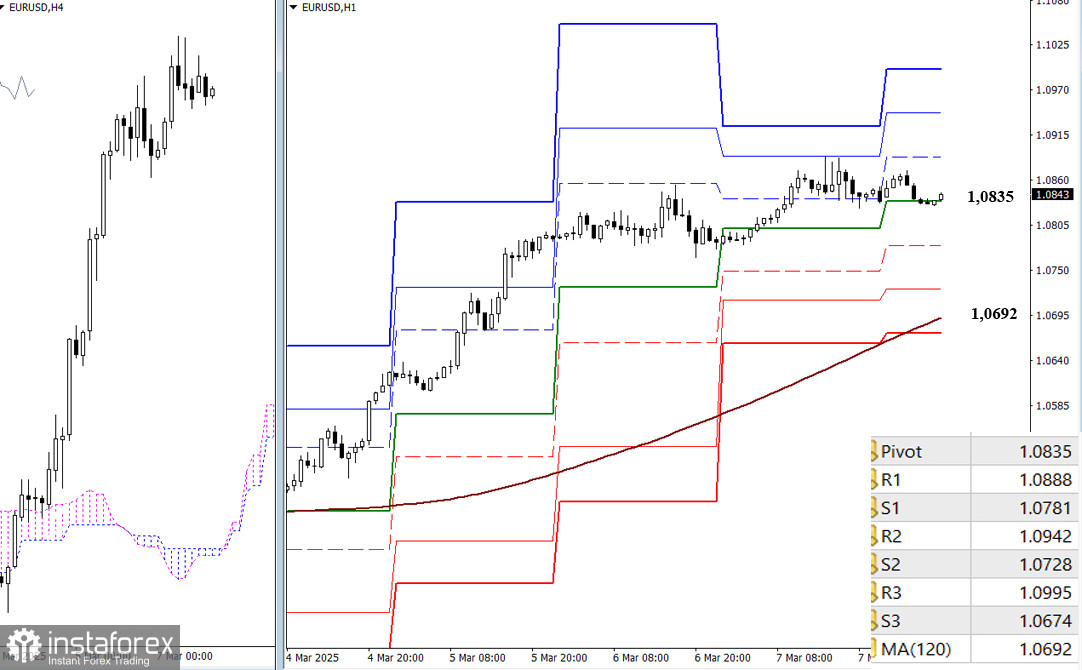
On lower timeframes, buyers currently hold the advantage. To maintain the upward movement, they need to break through the resistance at the classic Pivot levels for the day, which are positioned at 1.0888, 1.0942, and 1.0995. If the upward momentum fails, sellers may test the support levels at the classic Pivot points (1.0781 to 1.0728) before reaching the weekly long-term trend at 1.0692. This trend is crucial in determining the current balance of power, so a breakout and reversal below this level would enable sellers to plan for a longer-term downward move.

***

GBP/USD

This image is no longer relevant

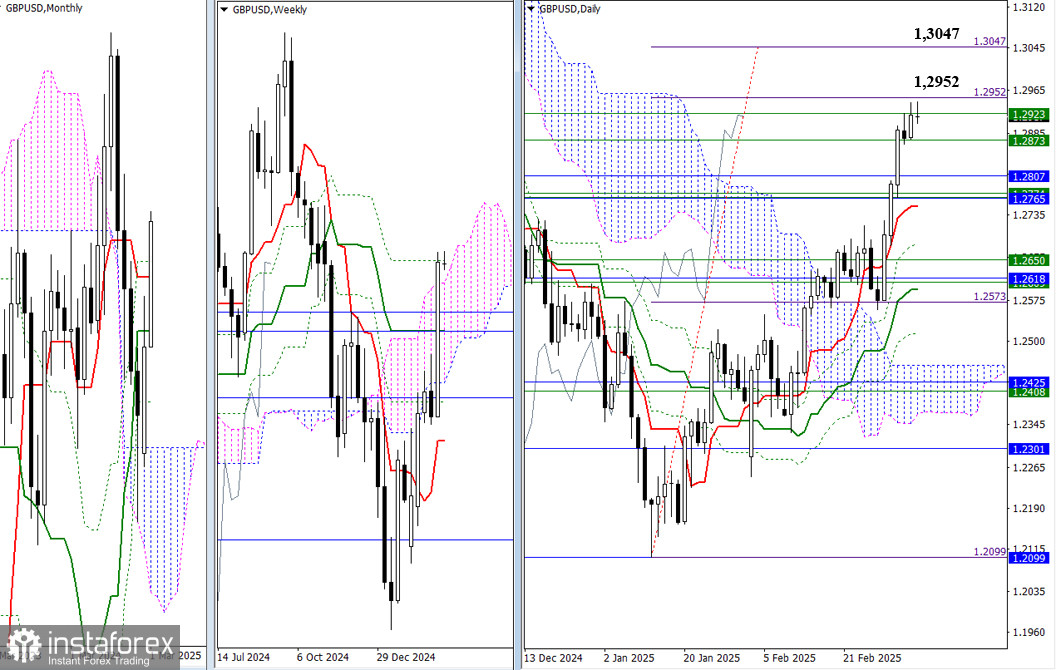
Buyers are currently facing a significant resistance zone. Although several levels have been surpassed, the target for a breakout, represented by the daily Ichimoku cloud (ranging from 1.2952 to 1.3047), remains a hurdle. A successful breakout and consolidation above this zone could lead to new bullish targets, including a potential rise to the nearest high at 1.3433. However, if buyers fail at this point, bearish activity could revert to the previously established support zone (between 1.2873 and 1.2751).

This image is no longer relevant

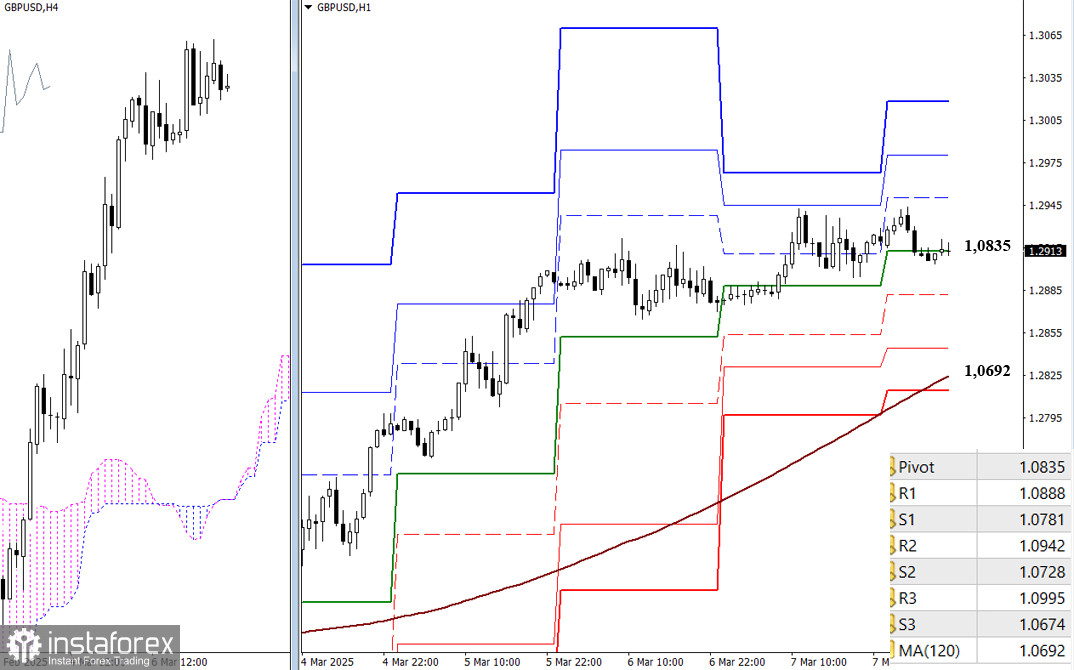
On lower timeframes, buyers are in a more favorable position. Key reference points for maintaining upward momentum throughout the day are located at the classic Pivot levels of 1.2950, 1.2981, and 1.3018. If a corrective decline occurs, the pair may find support at the classic Pivot levels (ranging from 1.2882 to 1.2845), followed by a longer-term weekly trend line at 1.0692. A breakout below this trend could shift the balance of power in favor of sellers.

***

Technical Analysis Components:
  • Higher Timeframes: Ichimoku Kinko Hyo (9.26.52) and Fibonacci Kijun levels
  • H1: Classic Pivot Points and 120-period Moving Average (weekly long-term trend)

Recommended Stories

یورو / یو ایس ڈی کے لئے 19 اگست 2025 کو اشارے کا تجزیہ

پیر کو، جوڑا نیچے کی طرف چلا گیا، 1.1658 (پتلی نیلی لائن) پر 8-روزہ ای ایم اے کی جانچ کر رہا تھا، اور روزانہ کینڈل کو 1.1659

Stefan Doll 15:35 2025-08-19 UTC+2

جی بی پی / یو ایس ڈی۔ 19 اگست 2025 کو اشارے کا تجزیہ

پیر کو، جوڑا نیچے کی طرف بڑھا، 1.3509 (پتلی سرخ لکیر) پر 5-day EMA سے نیچے ٹوٹ گیا، اور روزانہ کینڈل کو 1.3500 پر بند کر دیا۔ آج، قیمت

Stefan Doll 15:16 2025-08-19 UTC+2

جی بی پی / یو ایس ڈی۔ 18 اگست۔ ڈالر کو سپورٹ کی کمی ہے۔

گھنٹہ وار چارٹ پر، جمعہ کو جی بی پی / یو ایس ڈی نے 1.3586 پر 100.0% ریٹریسمنٹ لیول کی طرف ایک اصلاحی پل بیک کا مظاہرہ کیا۔ تاہم، آخری

Samir Klishi 16:16 2025-08-18 UTC+2

یورو / یو ایس ڈی کی پیشن گوئی برائے18 اگست 2025

جمعہ کو، یورو / یو ایس ڈی پئیر 1.1637–1.1645 کے سپورٹ زون سے ریباؤنڈ ہوا، یورو کے حق میں ہو گیا، اور 1.1695 پر 76.4% ریٹریسمنٹ لیول سے اوپر مضبوط

Samir Klishi 16:05 2025-08-18 UTC+2

یورو / یو ایس ڈی : تجزیہ اور پیشن گوئی

اس وقت، جوڑی 1.1700 کی راؤنڈ سطح پر ہے، پچھلے ہفتے کی بلند ترین سطح کے قریب۔ جمعے کا ڈھنگ کا نمونہ بتاتا ہے کہ جوڑا کچھ اصلاح کے ساتھ

Irina Yanina 15:41 2025-08-18 UTC+2

یو ایس ڈی / جے پی وائے تجزیہ، پیشن گوئی، اور موجودہ مارکیٹ کی صورتحال

تکنیکی نقطہ نظر سے، 146.20 کی سطح سے یو ایس ڈی / جے پی وائے میں کل کا مضبوط ریباؤنڈ 148.00 کے راؤنڈ فگر پر رک گیا۔

Irina Yanina 16:34 2025-08-15 UTC+2

اگست 15-19 2025 کے لیے بٹ کوائن کے لیے تجارتی اشارہ : $120,000 سے نیچے فروخت کریں (6/8 مرے - 21 ایس ایم اے)

اگر بٹ کوائن 6/8 مرے کی سطح سے اوپر 118,750 پر مستحکم ہو جاتا ہے، جو کہ اب کلیدی معاونت بن چکا ہے، آنے والے گھنٹوں میں،

Dimitrios Zappas 16:26 2025-08-15 UTC+2

اگست 15-19 2025 کے لیے سونے کے لیے تجارتی سگنل: $3,365 سے نیچے فروخت (200 ای ایم اے - 21 ایس ایم اے)

اگر آنے والے گھنٹوں میں سونا 200ای ایم اے سے نیچے 3,350 پر مستحکم ہوتا ہے، تو کسی بھی تکنیکی ریباؤنڈ کو فروخت کے لیے ایک سگنل

Dimitrios Zappas 15:20 2025-08-15 UTC+2

سونا : تجزیہ اور پیشن گوئی

یہ کہ $3358 کی سطح سے اوپر کا بریک آؤٹ، جہاں 4 گھنٹے کے چارٹ پر 100 پیریڈ سادہ موونگ ایوریج (ایس ایم اے) واقع ہے، اس ہفتے کے شروع

Irina Yanina 17:24 2025-08-14 UTC+2

جی بی پی / یو ایس ڈی 14 اگست 2025 کو اشارے کا تجزیہ

بدھ کو، جوڑے نے، اوپر کی طرف بڑھتے ہوئے، 1.3587 (ریڈ ڈیشڈ لائن) پر اوپری فریکٹل کا تجربہ کیا اور پھر 1.3571 پر یومیہ موم بتی بند کرتے ہوئے تھوڑا

Stefan Doll 17:14 2025-08-14 UTC+2
ابھی فوری بات نہیں کرسکتے ؟
اپنا سوال پوچھیں بذریعہ چیٹ.
 

Dear visitor,

Your IP address shows that you are currently located in the USA. If you are a resident of the United States, you are prohibited from using the services of InstaFintech Group including online trading, online transfers, deposit/withdrawal of funds, etc.

If you think you are seeing this message by mistake and your location is not the US, kindly proceed to the website. Otherwise, you must leave the website in order to comply with government restrictions.

Why does your IP address show your location as the USA?

  • - you are using a VPN provided by a hosting company based in the United States;
  • - your IP does not have proper WHOIS records;
  • - an error occurred in the WHOIS geolocation database.

Please confirm whether you are a US resident or not by clicking the relevant button below. If you choose the wrong option, being a US resident, you will not be able to open an account with InstaTrade anyway.

We are sorry for any inconvenience caused by this message.