یہ بھی دیکھیں

 12.03.2025 10:28 AM
On Wednesday, the market may begin moving downward from the 1.2942 level (previous daily close), targeting 1.2905—the 14.6% retracement level (yellow dashed line). Upon testing this level, the price may rebound upwards, aiming for 1.2977—resistance line (bold blue line).
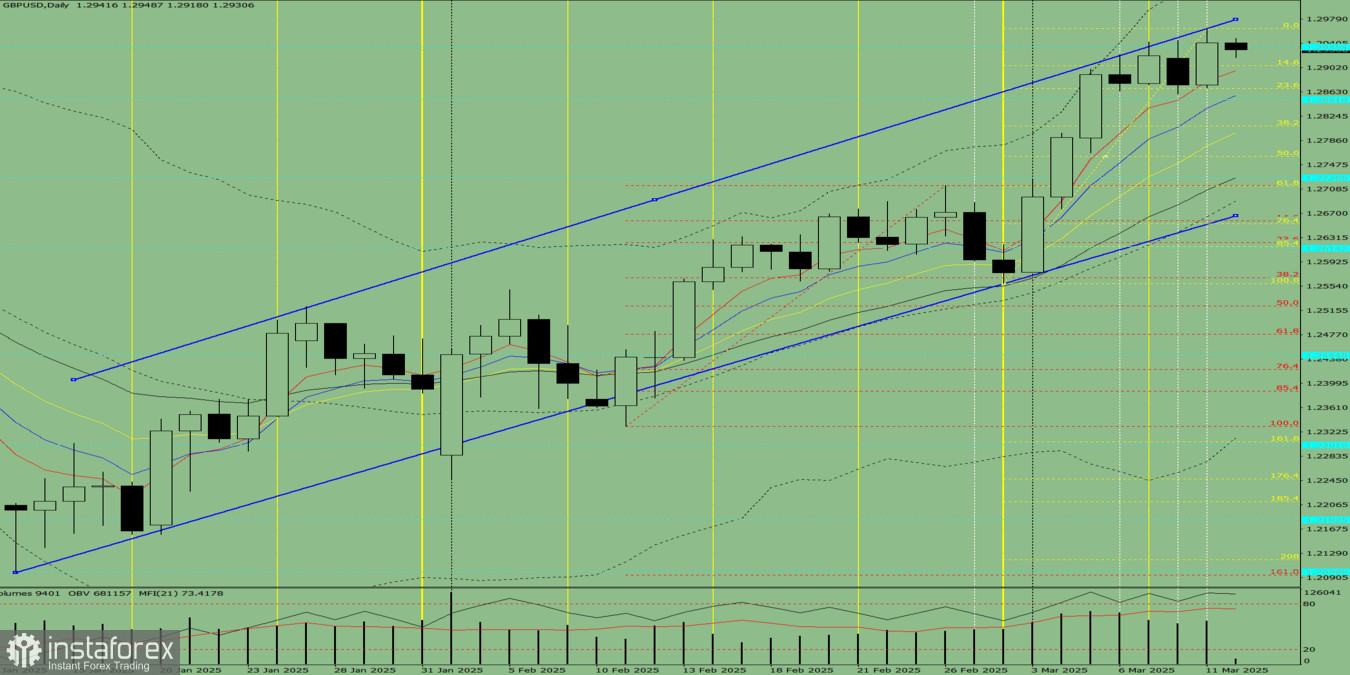
Alternative Scenario: If the market starts declining from the 1.2942 level, it may target 1.2868 (23.6% retracement level, yellow dashed line). If this level is tested, the price may rebound upwards toward 1.2977—resistance line (bold blue line).
You have already liked this post today
*تعینات کیا مراد ہے مارکیٹ کے تجزیات یہاں ارسال کیے جاتے ہیں جس کا مقصد آپ کی بیداری بڑھانا ہے، لیکن تجارت کرنے کے لئے ہدایات دینا نہیں.


