یہ بھی دیکھیں

 25.03.2025 07:04 PM
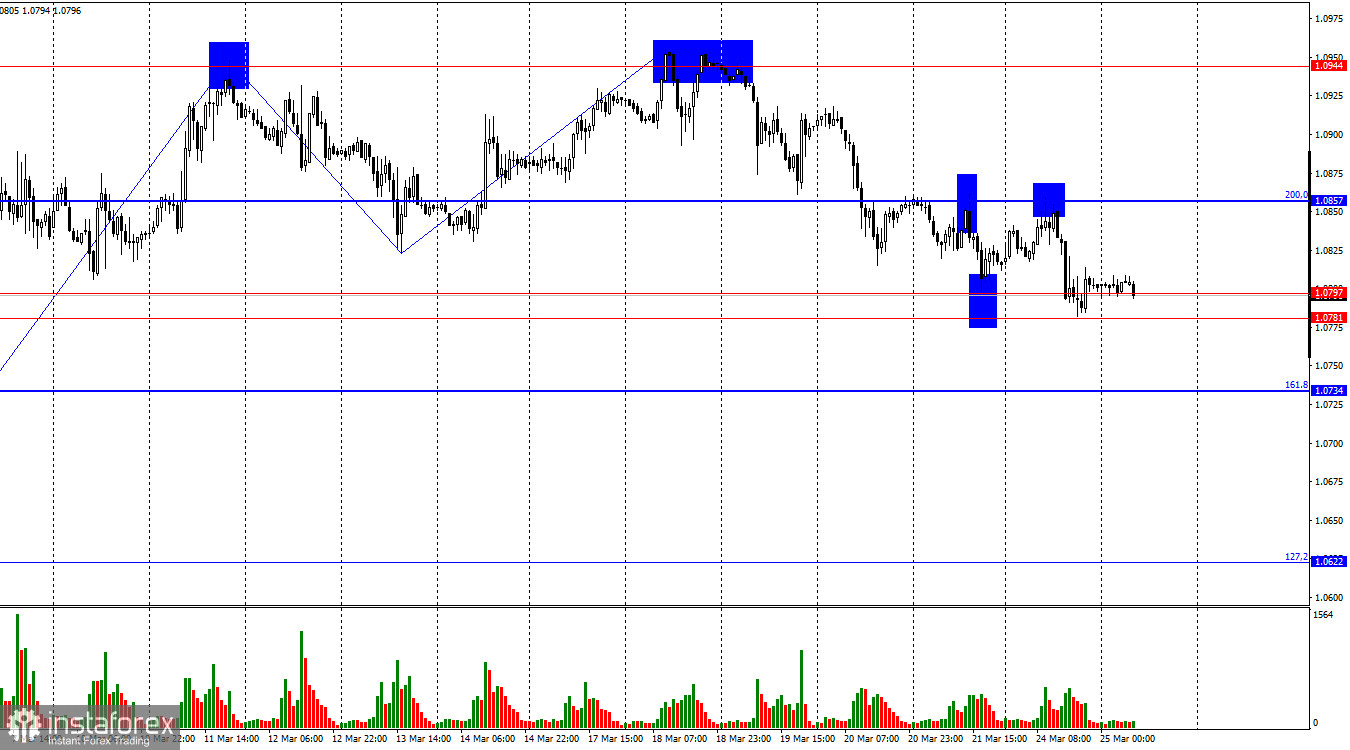
On Monday, the EUR/USD pair rebounded from the 200.0% Fibonacci retracement level at 1.0857, reversed in favor of the U.S. dollar, and declined toward the support zone of 1.0781–1.0797. A rebound from this zone today would favor the euro and trigger a new upward move toward the 1.0857 level. A firm consolidation below this zone will increase the likelihood of a continued decline toward the next Fibonacci level of 161.8% at 1.0734.
The wave situation on the hourly chart has changed. The last completed upward wave only slightly surpassed the previous peak, while the most recent downward wave barely broke the previous low. As a result, the current wave pattern still points to a bullish trend, but it may begin to reverse soon as the bulls appear to have run out of momentum. For several weeks, Donald Trump's tariffs have put strong pressure on the dollar, but this won't last forever.
On Monday, the news background was of interest to traders, but most of the reports failed to answer the key question: what to do with the euro and the dollar? PMI data can often hint at future economic trends, but yesterday wasn't one of those days. Manufacturing PMIs in Germany and the Eurozone improved, but the Services PMIs declined. Overall, it's hard to say whether the European economy is recovering or slowing down. In my view, it's doing neither — it's stagnating.
There will be few important events this week, so traders may shift their focus to next week when the news background becomes more significant. In early April, we'll find out which tariffs Donald Trump plans to impose on trade partners around the world, which could have a highly negative impact on bearish positions. Historically, markets have reacted very negatively to the introduction of tariffs. For now, the dollar is enjoying a brief reprieve.
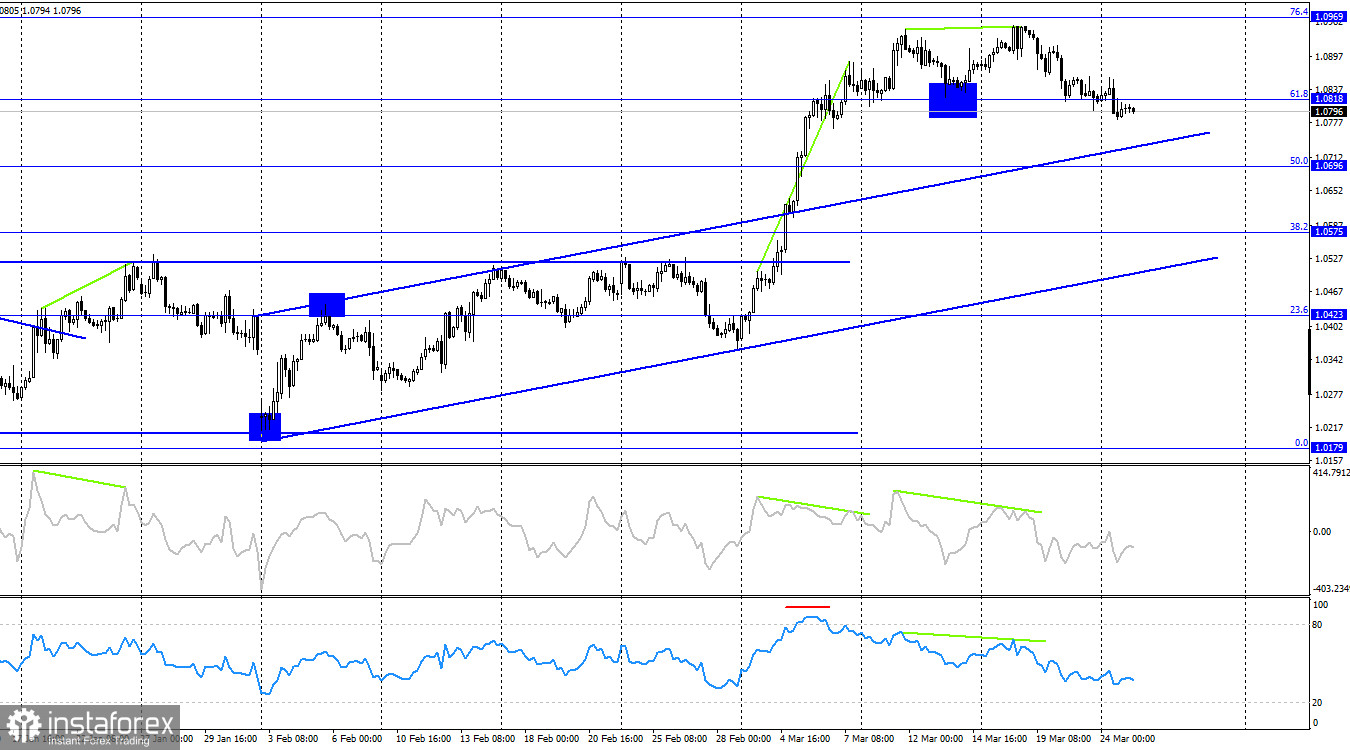
On the 4-hour chart, the pair reversed in favor of the U.S. dollar following another "bearish" divergence and closed below the 61.8% Fibonacci level at 1.0818. Therefore, a further decline toward the next retracement level of 50.0% at 1.0696 can be expected. The euro has room to fall, as the price is still above the ascending trend channel. No new divergences are currently forming on any indicator.
Commitments of Traders (COT) Report:
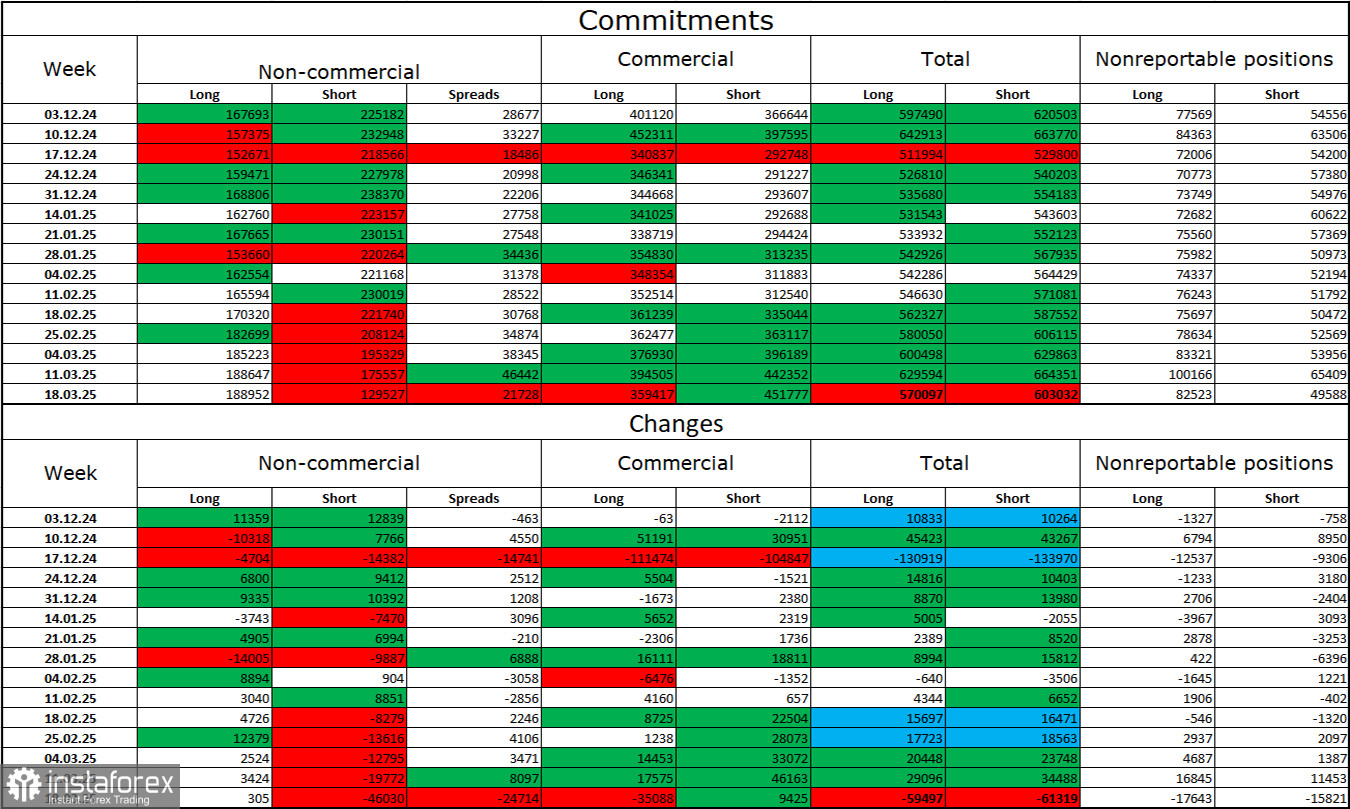
During the last reporting week, professional traders opened 305 new long positions and closed 46,030 short positions. The sentiment of the "Non-commercial" group has turned bullish again — thanks to Donald Trump. The total number of long positions held by speculators now stands at 189,000, while short positions have decreased to 129,000.
For 20 consecutive weeks, large traders had been selling off the euro, but they've now been cutting short positions and increasing longs for six weeks in a row. The divergence in monetary policy approaches between the ECB and the Fed still favors the U.S. dollar due to the interest rate differential. However, Donald Trump's policy is now a stronger factor for traders, as it may push the Fed toward a more dovish stance and potentially trigger a recession in the U.S. economy.
News Calendar for the U.S. and the Eurozone:
Eurozone – Ifo Business Climate Index in Germany (09:00 UTC) U.S. – New Home Sales (14:00 UTC)
The economic calendar for March 25 includes two secondary-tier releases. The news background is expected to have a very weak influence on market sentiment on Tuesday.
EUR/USD Forecast and Trader Tips:
Selling the pair was possible after a rebound from 1.0944 and 1.0857 on the hourly chart, targeting 1.0857 and 1.0797 — all of which were achieved. New short positions will be possible upon a confirmed break below the 1.0781–1.0797 zone, with targets at 1.0734 and 1.0622. Buying can be considered after a rebound from the 1.0781–1.0797 zone on the hourly chart, targeting 1.0857.
Fibonacci grids are plotted from 1.0529–1.0213 on the hourly chart and from 1.1214–1.0179 on the 4-hour chart.


