empty
28.04.2025 03:51 AM
USD/JPY – Summary and Prospects

This image is no longer relevant

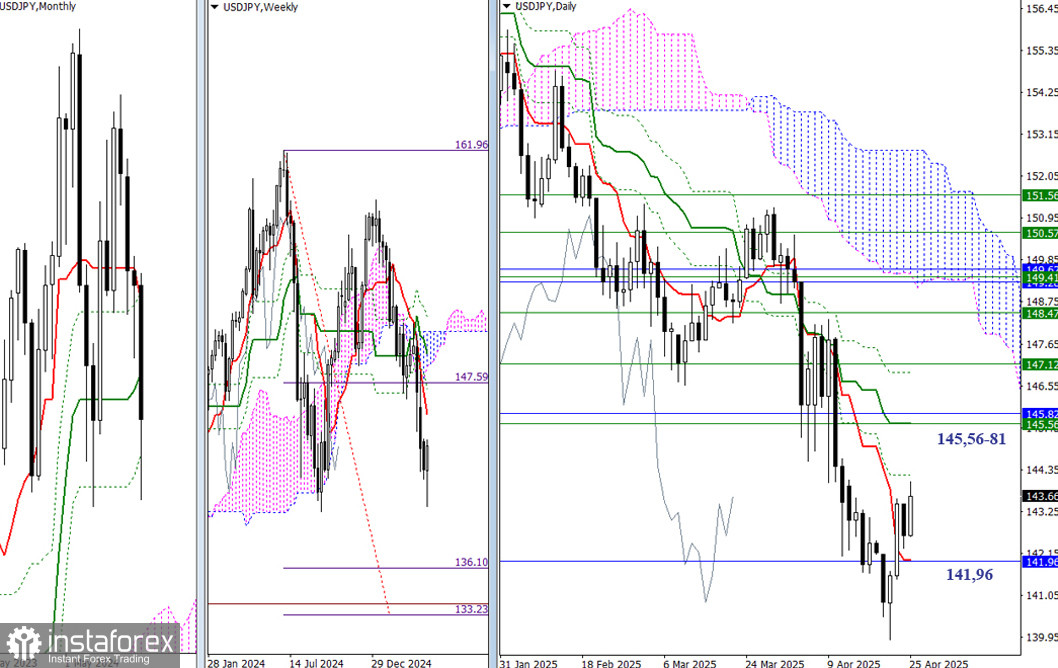
Last week, the market updated the low, but the sellers failed to continue the downward movement fully. This may have been because the previous week's low (141.63) was reinforced by the monthly support level (141.96). Consequently, the decline was halted, and the pair began showing upward correction. Thanks to this correction, the bulls reclaimed support from the daily short-term trend, which is currently located at 141.97, and continue pushing upward.

The nearest targets at the moment are the resistances of the daily Ichimoku cross (144.22 – 145.56), now reinforced by the weekly short-term trend (145.56) and the monthly medium-term trend (145.81). Overcoming these resistance levels will shift the market's focus towards new prospects.

If the corrective rise ends and the pair falls below the nearest support around 141.96 (the final level of the monthly Ichimoku cross + the daily Tenkan), it will pose new challenges for the sellers. The bears will need to restore the downtrend (139.90) and continue the decline toward the weekly targets for breaking through the cloud (133.23 – 136.10), reinforced by the upper boundary of the monthly cloud (133.88).

This image is no longer relevant

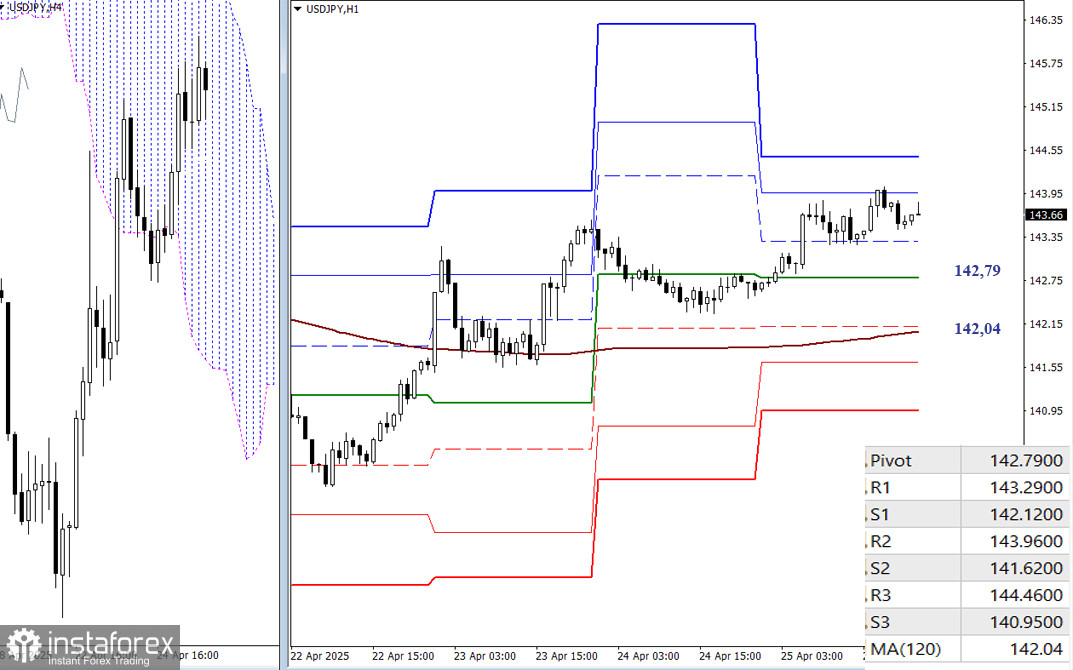
The buyers currently have the main advantage. The resistances of the classic pivot levels will be additional reference points for intraday growth development.

Upon completion of the rise, the nearest and most important reference points will be the supports of the key levels: 142.79 (the daily central Pivot level) and 142.04 (the weekly long-term trend). A breakthrough and reversal of the trend would transfer the main advantage to the sellers, thus supporting the further development of bearish sentiment. Reference points for the intraday decline are supports of the classic pivot levels. The actual Pivot values will be available at the market open and updated daily.

***

Technical Analysis Components:
  • Higher Timeframes: Ichimoku Kinko Hyo (9.26.52) and Fibonacci Kijun levels
  • H1: Classic Pivot Points and 120-period Moving Average (weekly long-term trend)

Recommended Stories

ایکس اے یو / یو ایس ڈی : تجزیہ اور پیشن گوئی

تکنیکی نقطہ نظر سے، سونا 4 گھنٹے کے چارٹ پر 200 مدت کے سادہ موونگ ایوریج (ایس ایم اے) سے اوپر رکھنے کا انتظام کر رہا ہے، جو ایک کلیدی

Irina Yanina 19:46 2025-08-12 UTC+2

اگست 12-15 2025 کے لیے یورو / یو ایس ڈی کے لیے تجارتی سگنل: 1.1647 سے نیچے فروخت کریں (200 ای ایم اے - 7/8 مرے)

یورو 1.1618 کے ارد گرد ٹریڈ کر رہا ہے، 200 ای ایم اے کے اوپر اور 6/8 مرے سے اوپر، پچھلے دن کے کچھ نقصانات کو ٹھیک

Dimitrios Zappas 16:22 2025-08-12 UTC+2

12-15 اگست 2025 کے لیے سونے (ایکس اے یو / یو ایس ڈی) کے لیے تجارتی اشارہ: $3,341 سے اوپر خریدیں یا $3,335 سے نیچے فروخت کریں (21 ایس ایم اے - 200 ای ایم اے)

اگر سونا 3,340 سے نیچے آتا ہے تو آؤٹ لک منفی ہو سکتا ہے۔ اس کے بعد یہ اپنی نیچے کی طرف حرکت دوبارہ شروع کر سکتا ہے،

Dimitrios Zappas 15:42 2025-08-12 UTC+2

اگست 11 2025 کو جی بی پی / یو ایس ڈی کی پیشن گوئی

گھنٹہ وار چارٹ پر، جمعہ کے روز جی بی پی / یو ایس ڈی نے 1.3425 کی سطح سے دو ریباؤنڈز بنائے، اور پیر کو 1.3470 پر 76.4% ریٹریسمنٹ لیول

Samir Klishi 19:29 2025-08-11 UTC+2

اگست 11 2025 کو یورو / یو ایس ڈی کی پیشن گوئی

جمعہ کو، یورو / یو ایس ڈی نے 1.1637–1.1645 سپورٹ زون سے دو ریباؤنڈ کیے اور یورو کے حق میں ہو گئے۔ اس کا مطلب ہے کہ اوپر کی حرکت

Samir Klishi 19:24 2025-08-11 UTC+2

اگست 11-15 2025 کے لیے سونے (ایکس اے یو / یو ایس ڈی) کے لیے تجارتی اشارہ: $3,380 سے نیچے فروخت کریں یا 3,341 ریباؤنڈ ہونے پر خریدیں (21 ایس ایم اے - 7/8 مرے)

ایگل انڈیکیٹر ایک منفی اشارہ دکھا رہا ہے، لہذا اگر ہم خرید رہے ہیں تو ہمیں بہت محتاط رہنا چاہیے، کیونکہ آنے والے گھنٹوں اور پورے ہفتے میں مندی

Dimitrios Zappas 18:56 2025-08-11 UTC+2

اگست 11-15 2025 کے لیے یورو / یو ایس ڈی کے لیے تجارتی سگنل: 1.1650 سے نیچے فروخت کریں (200 ای ایم اے - 7/8 مرے)

اگر آنے والے دنوں میں یورو 1.1650 سے نیچے مضبوط ہو جاتا ہے، تو کسی بھی تکنیکی ریباؤنڈ کو فروخت جاری رکھنے کے موقع کے طور پر دیکھا جائے گا۔

Dimitrios Zappas 18:53 2025-08-11 UTC+2

اگست 8-11 2025 کے لیے بٹ کوائن کے لیے تجارتی سگنل: $117,800 سے نیچے فروخت کریں (200 ای ایم اے - 21 ایس ایم اے)

یہ کہ $115,000 سے نیچے کی کمی بیئرش سائیکل کو بحال کر سکتی ہے۔ لہذا، ہم توقع کرتے ہیں کہ بٹ کوائن 112,500 پر مرے کے 4/8 تک پہنچ جائے

Dimitrios Zappas 20:08 2025-08-10 UTC+2

اگست 8-11 2025 کے لیے سونے (ایکس اے یو / یو ایس ڈی) کے لیے تجارتی سگنل: $3,407 سے نیچے فروخت (21 ایس ایم اے - 7/8 مرے)

اگر سونا آنے والے گھنٹوں میں اپنا تیزی کا چکر دوبارہ شروع کرتا ہے اور 3,382 سے اوپر جاتا ہے تو اسے 3,398 کے ہدف کے ساتھ خریداری جاری رکھنے

Dimitrios Zappas 20:05 2025-08-10 UTC+2

یو ایس ڈی / جے پی وائے۔ تجزیہ اور پیشن گوئی

تکنیکی نقطہ نظر سے، جگہ کی قیمتیں ہفتہ وار تجارتی حد کے اندر رہتی ہیں۔ تاہم، مکمل بیئرش کنسولیڈیشن کی تصدیق کرنا قبل از وقت ہے، کیونکہ روزانہ چارٹ

Irina Yanina 16:04 2025-08-08 UTC+2
ابھی فوری بات نہیں کرسکتے ؟
اپنا سوال پوچھیں بذریعہ چیٹ.
 

Dear visitor,

Your IP address shows that you are currently located in the USA. If you are a resident of the United States, you are prohibited from using the services of InstaFintech Group including online trading, online transfers, deposit/withdrawal of funds, etc.

If you think you are seeing this message by mistake and your location is not the US, kindly proceed to the website. Otherwise, you must leave the website in order to comply with government restrictions.

Why does your IP address show your location as the USA?

  • - you are using a VPN provided by a hosting company based in the United States;
  • - your IP does not have proper WHOIS records;
  • - an error occurred in the WHOIS geolocation database.

Please confirm whether you are a US resident or not by clicking the relevant button below. If you choose the wrong option, being a US resident, you will not be able to open an account with InstaTrade anyway.

We are sorry for any inconvenience caused by this message.