
یہ بھی دیکھیں


 18.08.2026 10:17 AM
On Monday, the EUR/USD pair reversed near the 100.0% corrective level at 1.1620 in favor of the US dollar and began moving lower toward the 76.4% corrective level at 1.1551. A rebound of the quotes from the 1.1551 level today would favor the euro and a resumption of growth toward 1.1620. Consolidation below the 1.1551 level would increase the likelihood of further declines and could lead to the end of the "bullish" trend.
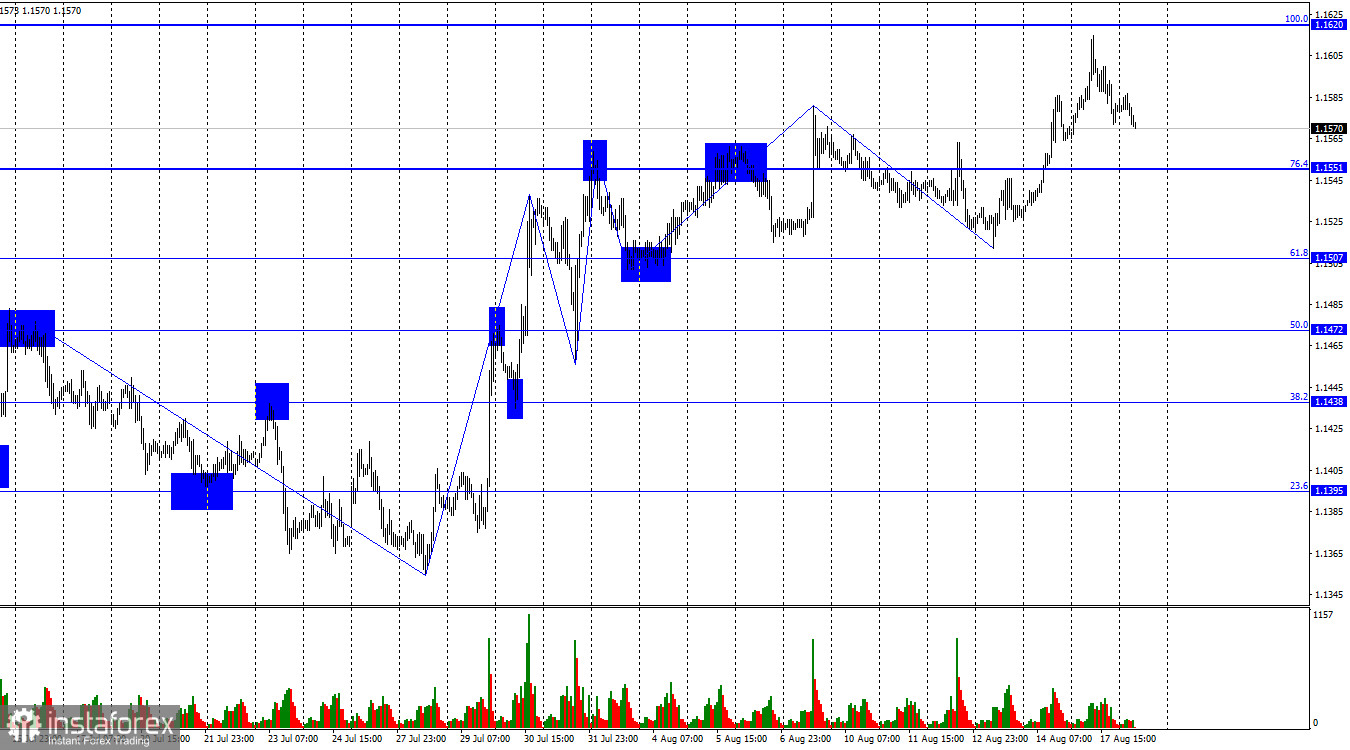
The wave structure on the hourly chart remains "bullish." The latest completed downward wave failed to break below the previous low, while the new upward wave broke above the previous peak. All current waves are extremely small in size. Geopolitical developments have raised hopes for the reopening of the Strait of Hormuz, while Iran, the United States, and Oman are attempting to reach an agreement on control over this strategically important waterway. However, the chances of success remain limited, and the market's "hawkish" expectations regarding FOMC monetary policy are easing.
The fundamental backdrop on Monday allowed the bulls to continue their attacks, but unexpected information emerged from Iran suggesting that Tehran may attempt to break the US blockade of the Strait of Hormuz in the near future. I would like to immediately note that this information is unofficial, so it remains unclear whether these are actual plans of the Iranian government or simply an attempt to intimidate the United States. In my view, any new escalation of the conflict would have extremely serious consequences. Donald Trump is currently forced to refrain from launching new strikes against Iran due to shortages of certain types of missiles and weapons. However, if Iran attacks the US Navy, Washington will be forced to respond. The necessary missiles would then be found very quickly, even if only from allies. Therefore, it is not difficult to conclude that any new confrontation between the US and Iran would lead to further increases in oil prices and accelerate inflation even more. The ECB could respond to such developments by tightening monetary policy, but whether the Fed would do the same remains a major question. I believe that any new escalation near the Strait of Hormuz would now work against the dollar rather than support it, unlike in the first half of 2026.
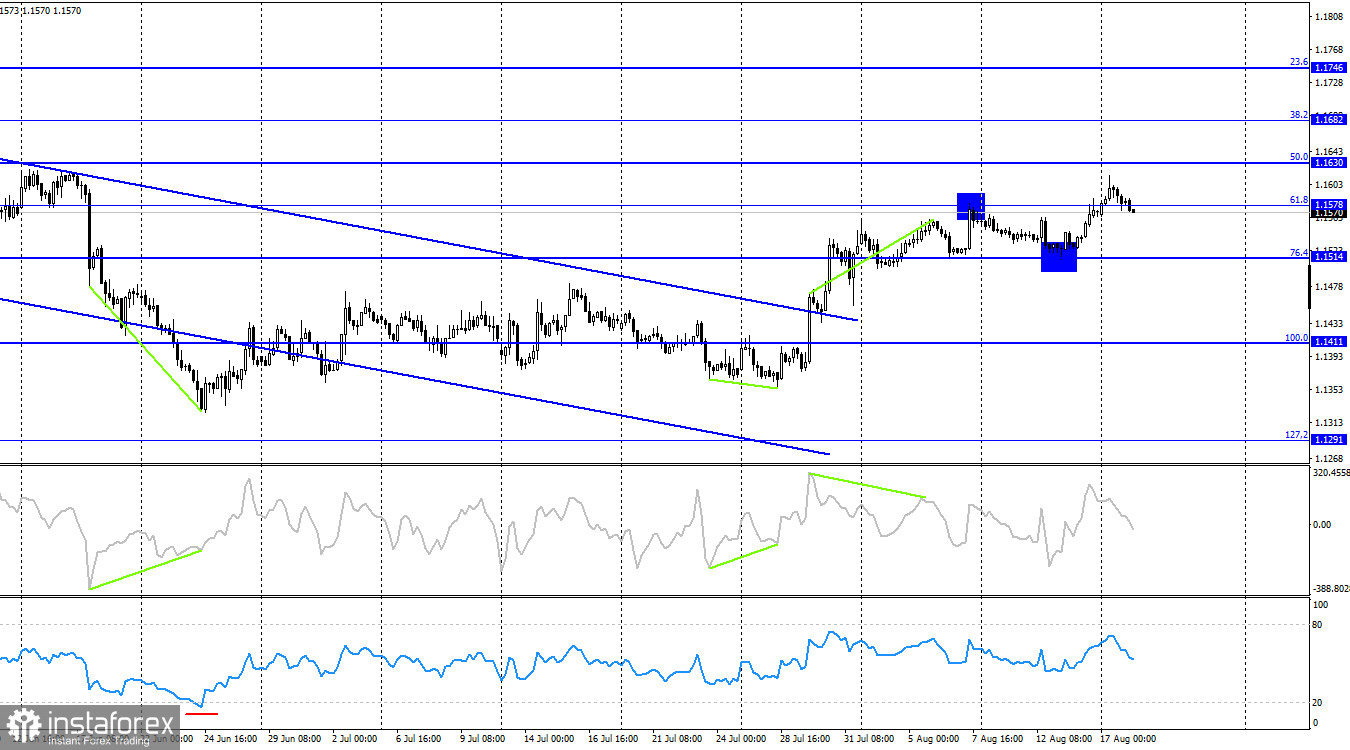
On the 4-hour chart, the pair consolidated above the downward trend channel, which suggests not just a "bullish" attack but a full-scale "bullish" advance and trend. A rebound of the quotes from the 1.1514 level once again allows the bulls to attack. No new emerging divergences are visible on any indicator. Consolidation above the 1.1578 level would suggest further growth toward the 50.0% Fibonacci level at 1.1630, but I would currently pay more attention to the hourly chart.
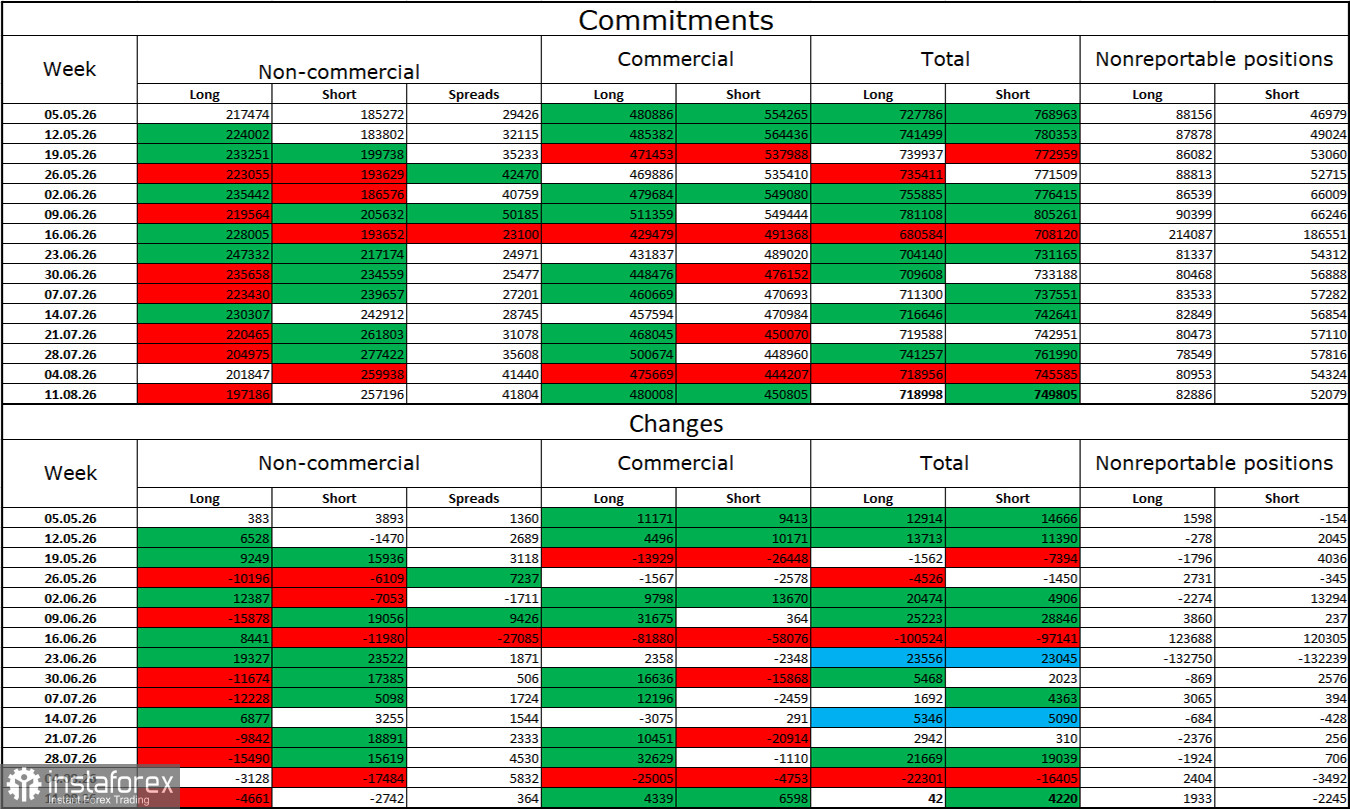
During the latest reporting week, professional traders closed 4,661 Long positions and 2,742 Short positions. Over the seven weeks in February and March, the overwhelming advantage of the bulls disappeared due to the war in Iran, while over the past twenty weeks the situation has become more balanced amid a false ceasefire and market expectations of an end to the war. The total number of Long positions held by speculators currently stands at 197 thousand, while Short positions amount to 257 thousand. The bears are once again taking the lead.
Overall, over the long term, large market participants continue to show significant interest in the euro. Of course, global events of various kinds, which have been abundant in recent years, affect investor sentiment. In particular, the market is currently closely monitoring developments in the Middle East, where the war appears to end and then resume again. The market initially ignored the ceasefire and later ignored the resumption of hostilities. Therefore, geopolitics no longer determines the dollar's direction on its own.
The economic calendar for August 18 contains six events, but I cannot consider any of them important. The impact of the economic backdrop on market sentiment on Tuesday will most likely be weak.
Buying opportunities are possible today after a rebound from the 1.1551 level on the hourly chart, with a target of 1.1620. Selling opportunities are possible after consolidation below the 1.1551 level on the hourly chart, with a target of 1.1507.
The Fibonacci grids are drawn from 1.1620 to 1.1325 on the hourly chart and from 1.1411 to 1.1850 on the 4-hour chart.


